The exposures I study are invisible to the systems built to catch them, and impossible to miss if you live there. I count them.
Hazards do not arrive one at a time
Exposures that arrive together
Environmental hazards are studied one at a time and scored as though they add up. My own work asks whether that holds, who ends up inside the overlap, and what it costs them.
01 / STRUCTUREDo they arrive together?
Most hazard pairs are not independent. Some cluster, some almost exclude one another, and the two tendencies cancel when you add them up — so an index built on averages looks safe and understates the places carrying the most.
02 / DISTRIBUTIONWho lives inside the overlap?
Joint exposure is not spread evenly across a city. Measuring where two burdens land on the same neighbourhood shows a wider gap than either one measured on its own would suggest.
03 / CONSEQUENCEWhat does it cost?
The same hazard is not equally survivable everywhere. Comparing outcomes within one place, in one year, separates how much exposure people receive from how much harm it does them.
Measurement where there is none
Work with the Community Noise Lab, at the other end of the scale. One school district, one neighbourhood, a few hundred buildings — places with no monitoring record at all.
04 / FIRST COUNTBuilding the record
Soil contamination, hearing screening, a statewide sign census. Datasets that did not exist before, and the calibration work that lets other people trust them.
05 / BUILT ENVWhat a place offers
Shops, signs, streets and derelict lots, treated as exposure. Not chosen, not easily avoided, and rarely counted by anyone.
06 / METHODSSmall samples, honest claims
Spatial dependence, spillover between neighbours, and coverage-aware frames that reconstruct where a survey looked rather than only what it found.
Methods
Environmental exposure data is spatially dependent, measured with error, and observed under incomplete coverage. These are the approaches I work with.
Interference and spillover. Telling apart the case where one area's exposure changes its neighbour's outcome from two areas simply resembling each other.
Conditional autoregressive models. BYM2 models with penalised-complexity priors, fitted by integrated nested Laplace approximation, using which areas touch which to steady estimates where observation is thin.
Interpolation and areal linkage. Turning scattered measurements into a continuous surface, then matching it to the population units decisions are made in.
Copula-based joint modelling. Gaussian copulas with a block bootstrap, separating how often two exposures turn up together from how often both are extreme at once.
Instrument bias correction. Checking low-cost sensors against reference instruments, then testing the correction at sites left out of the calculation. Field work with Aeroqual, Temtop, portable XRF and GC-PID.
Coverage-aware sampling. Recording where the survey actually went, so an area with no data reads as unvisited rather than as somewhere nothing was found.
Composite index construction. Combining separate measurements into one comparable number, keeping the parts visible so nobody takes the total on trust.
Longitudinal establishment panels. Following how long each shop or site survives, so change within a place is told apart from change in what is being counted.
Bayesian estimation. Combining what is already known with what the data show, then checking how much of the answer depends on the assumptions it started from.
Panel models and specification ladders. Two-way fixed effects with clustered standard errors, reported across the full ladder of specifications rather than as a single preferred model.
Papers
First-authored work, and published papers I contributed to. Further co-authored manuscripts are on Google Scholar and the CV.
Published
- Mandalapu, S.V. (2025). The evolution of electronic health records in India: progress, challenges, and future prospects, 2020 to 2025. International Journal of Health Technology and Innovation, 4(2), 24-30. PublishedIndia set out to build a national digital health system, and by the middle of the decade adoption had split sharply between large urban hospitals and rural primary care. This traces what the policy delivered, where it stalled, and what the gap says about digitising health care in a country that size.
- Jimenez Medal, R., Jimenez, D., Mandalapu, S.V., & Walker, E.D. (2026). Hearing thresholds above age- and sex-based norms and an under-recognized hearing screening gap in short-haul truck drivers in Los Angeles, California. Preventive Medicine Reports, 70, 103598. PublishedShort-haul drivers sit in cab noise all day and almost never get their hearing checked. Screening them found thresholds well above what age alone would predict, in a workforce that falls outside every existing surveillance programme.
- Walker, E.D., Klevan, C., Mathews, K., Mandalapu, S.V., Nica, C., & Ibrahim, N. (2026). Hidden toxicities: assessing city-wide contamination by potentially toxic elements from illegal dumping in Jackson, Mississippi. Environmental Geochemistry and Health, 48, 603. PublishedIllegal dumping is easy to see and almost impossible to find in any official record. Measuring the soil at sites across one city shows what those piles leave behind, and how much sits within walking distance of homes.
- Holloway, T.T., Mandalapu, S.V., & Walker, E.D. (2026). Hearing health where audiologists are scarce: a pilot hearing screening of students and school staff in rural Mississippi. BMC Public Health. PublishedIn much of rural Mississippi the nearest audiologist is hours away, so hearing loss goes unrecorded rather than unnoticed. A tablet-based screening run in schools shows what a first count looks like where no service exists.
- Walker, E.D., Dotson, M., & Mandalapu, S.V. (2026). Illegal dumping and governing urban data blind spots. Nature Cities. PublishedA dumping site is immediately visible to the people living opposite it and absent from the systems meant to govern it. What cities cannot see, they cannot recover, and neither can the people who live with it.
Exposures that arrive together
- Mandalapu, S.V., Sharma, R., & Pillarisetti, A. (2026). Joint heat and PM2.5 exposure across US metropolitan areas: multi-stressor disparities, historical redlining, and a multi-metric assessment framework. Health & Place. Under reviewHot days and polluted days are usually studied separately, but they often land together, and not evenly across a city. The same disparity measured on five different exposure surfaces ranged from 3.97 to 1.47, which is a finding about the instruments as much as the neighbourhoods.
- Mandalapu, S.V., & Walker, E.D. (2026). Compound climate exposure and Black-White differences in cause-specific mortality across United States counties, 2010 to 2019. Environmental Research. Under reviewIn the same place and the same year, death rates climb more steeply with combined climate exposure for Black residents than for White residents, with a parallel gradient by county poverty. The gap is not explained by which counties people live in.
- Mandalapu, S.V., & Walker, E.D. (2026). Clustering and negative dependence among climate hazards offset in aggregate but intensify at the extremes. npj Natural Hazards. In preparationTwelve of fifteen hazard pairs depart from independence across 55,800 county-years. Some cluster, some almost exclude one another, and the two tendencies cancel when summed, so an additive index looks sound until the tail, which is where it matters most.
Food, retail and the built environment
- Mandalapu, S.V., Hornbuckle, E., Nica, C., Goedel, W.C., & Walker, E.D. (2026). Dollar dominance: dollar store expansion and grocery decline in Mississippi, 1997 to 2024. Public Health Nutrition. Under reviewOver a generation, dollar stores spread across the state while grocery stores closed. Following every shop that opened and closed shows how quickly the places people can buy food changed, and where the change was sharpest.
- Mandalapu, S.V., Lefebvre, S., & Walker, E.D. (2026). A dollar-aware food-environment index and a 27-year trajectory typology: a measurement foundation for diet and childhood-obesity research in Mississippi, 1997 to 2024. International Journal of Behavioral Nutrition and Physical Activity. Under reviewMost measures of a neighbourhood's food supply treat every shop the same and describe only the present day. This one accounts for what dollar stores actually stock, and follows how each area changed over a generation.
- Mandalapu, S.V., Lefebvre, S., & Walker, E.D. (2026). How new openings sustain the income gradient in unhealthy retail: evidence from a statewide establishment panel, Rhode Island, 2016 to 2025. Health & Place. Under reviewLower-income neighbourhoods have more alcohol and unhealthy food outlets, and that gap is usually put down to history. Following every opening and closure over a decade shows it is being actively maintained by where new businesses choose to open.
Methods, data and governance
- Mandalapu, S.V., Mwenda, K., & Walker, E.D. (2026). Spatial spillover and confounding in environmental epidemiology: matching methods to mechanisms. Current Environmental Health Reports. Under reviewWhen a factory pollutes one neighbourhood, its neighbours are affected too, and the usual statistical methods often cannot tell that apart from a place simply resembling the ones around it. This review sets out which approach to use depending on which is actually happening.
About
The places with the least environmental data are not the places with the least exposure. They are the places furthest from anyone who would come and measure. I would like to spend part of my career closing that gap where I am from.
Where I come from
ACCESSI grew up in a remote village in Andhra Pradesh, India, where school was a distance away and higher education further still. Getting to either was the hard part, not the studying. My parents got there, later than they should have. The difficulty was never ability. It was access.
EARTHIn those same classrooms I was taught to call the earth our mother, पृथ्वी or अवनी, Pṛthvī or avanee, before I was taught anything about it. It was said so often that it stopped registering, and it took me years to hear it as anything more than a phrase.
How I got here
ENGINEERING AND BIOLOGYWhere I started
Biotechnology taught me what a measurement actually means. Biomedical engineering taught me how to build the instrument that produces one, and how to prove it is telling the truth.
PUBLIC HEALTHWhere I work now
What that measurement can honestly support once it stops being a reading on a screen and becomes a claim about the health of people who live somewhere.
It is one skill at two scales: knowing how a number was produced, and knowing what can be concluded from it. Most of what I do sits in the gap between those two.
TRANSLATEHaving worked across biology, engineering and public health, I am used to rooms where nobody shares a vocabulary, including the ones where most people are not researchers at all.
Elsewhere
Play
Two things I built while working out how to explain this. Neither is data; both are illustrative.
Where would you measure?
A monitoring network is a sampling design. Move the sliders and watch how much of the world's population falls inside detection range, and how fast that collapses when sites cluster around the places already being watched.
Where would you measure?
Coastlines are Natural Earth. Sites and exposures are illustrative, not measurements.
Live globe
Earthquakes from USGS, active fires from NASA FIRMS, events from NASA EONET and satellite orbits from CelesTrak, drawn on a globe as they are reported. Opens full screen.
Pictures
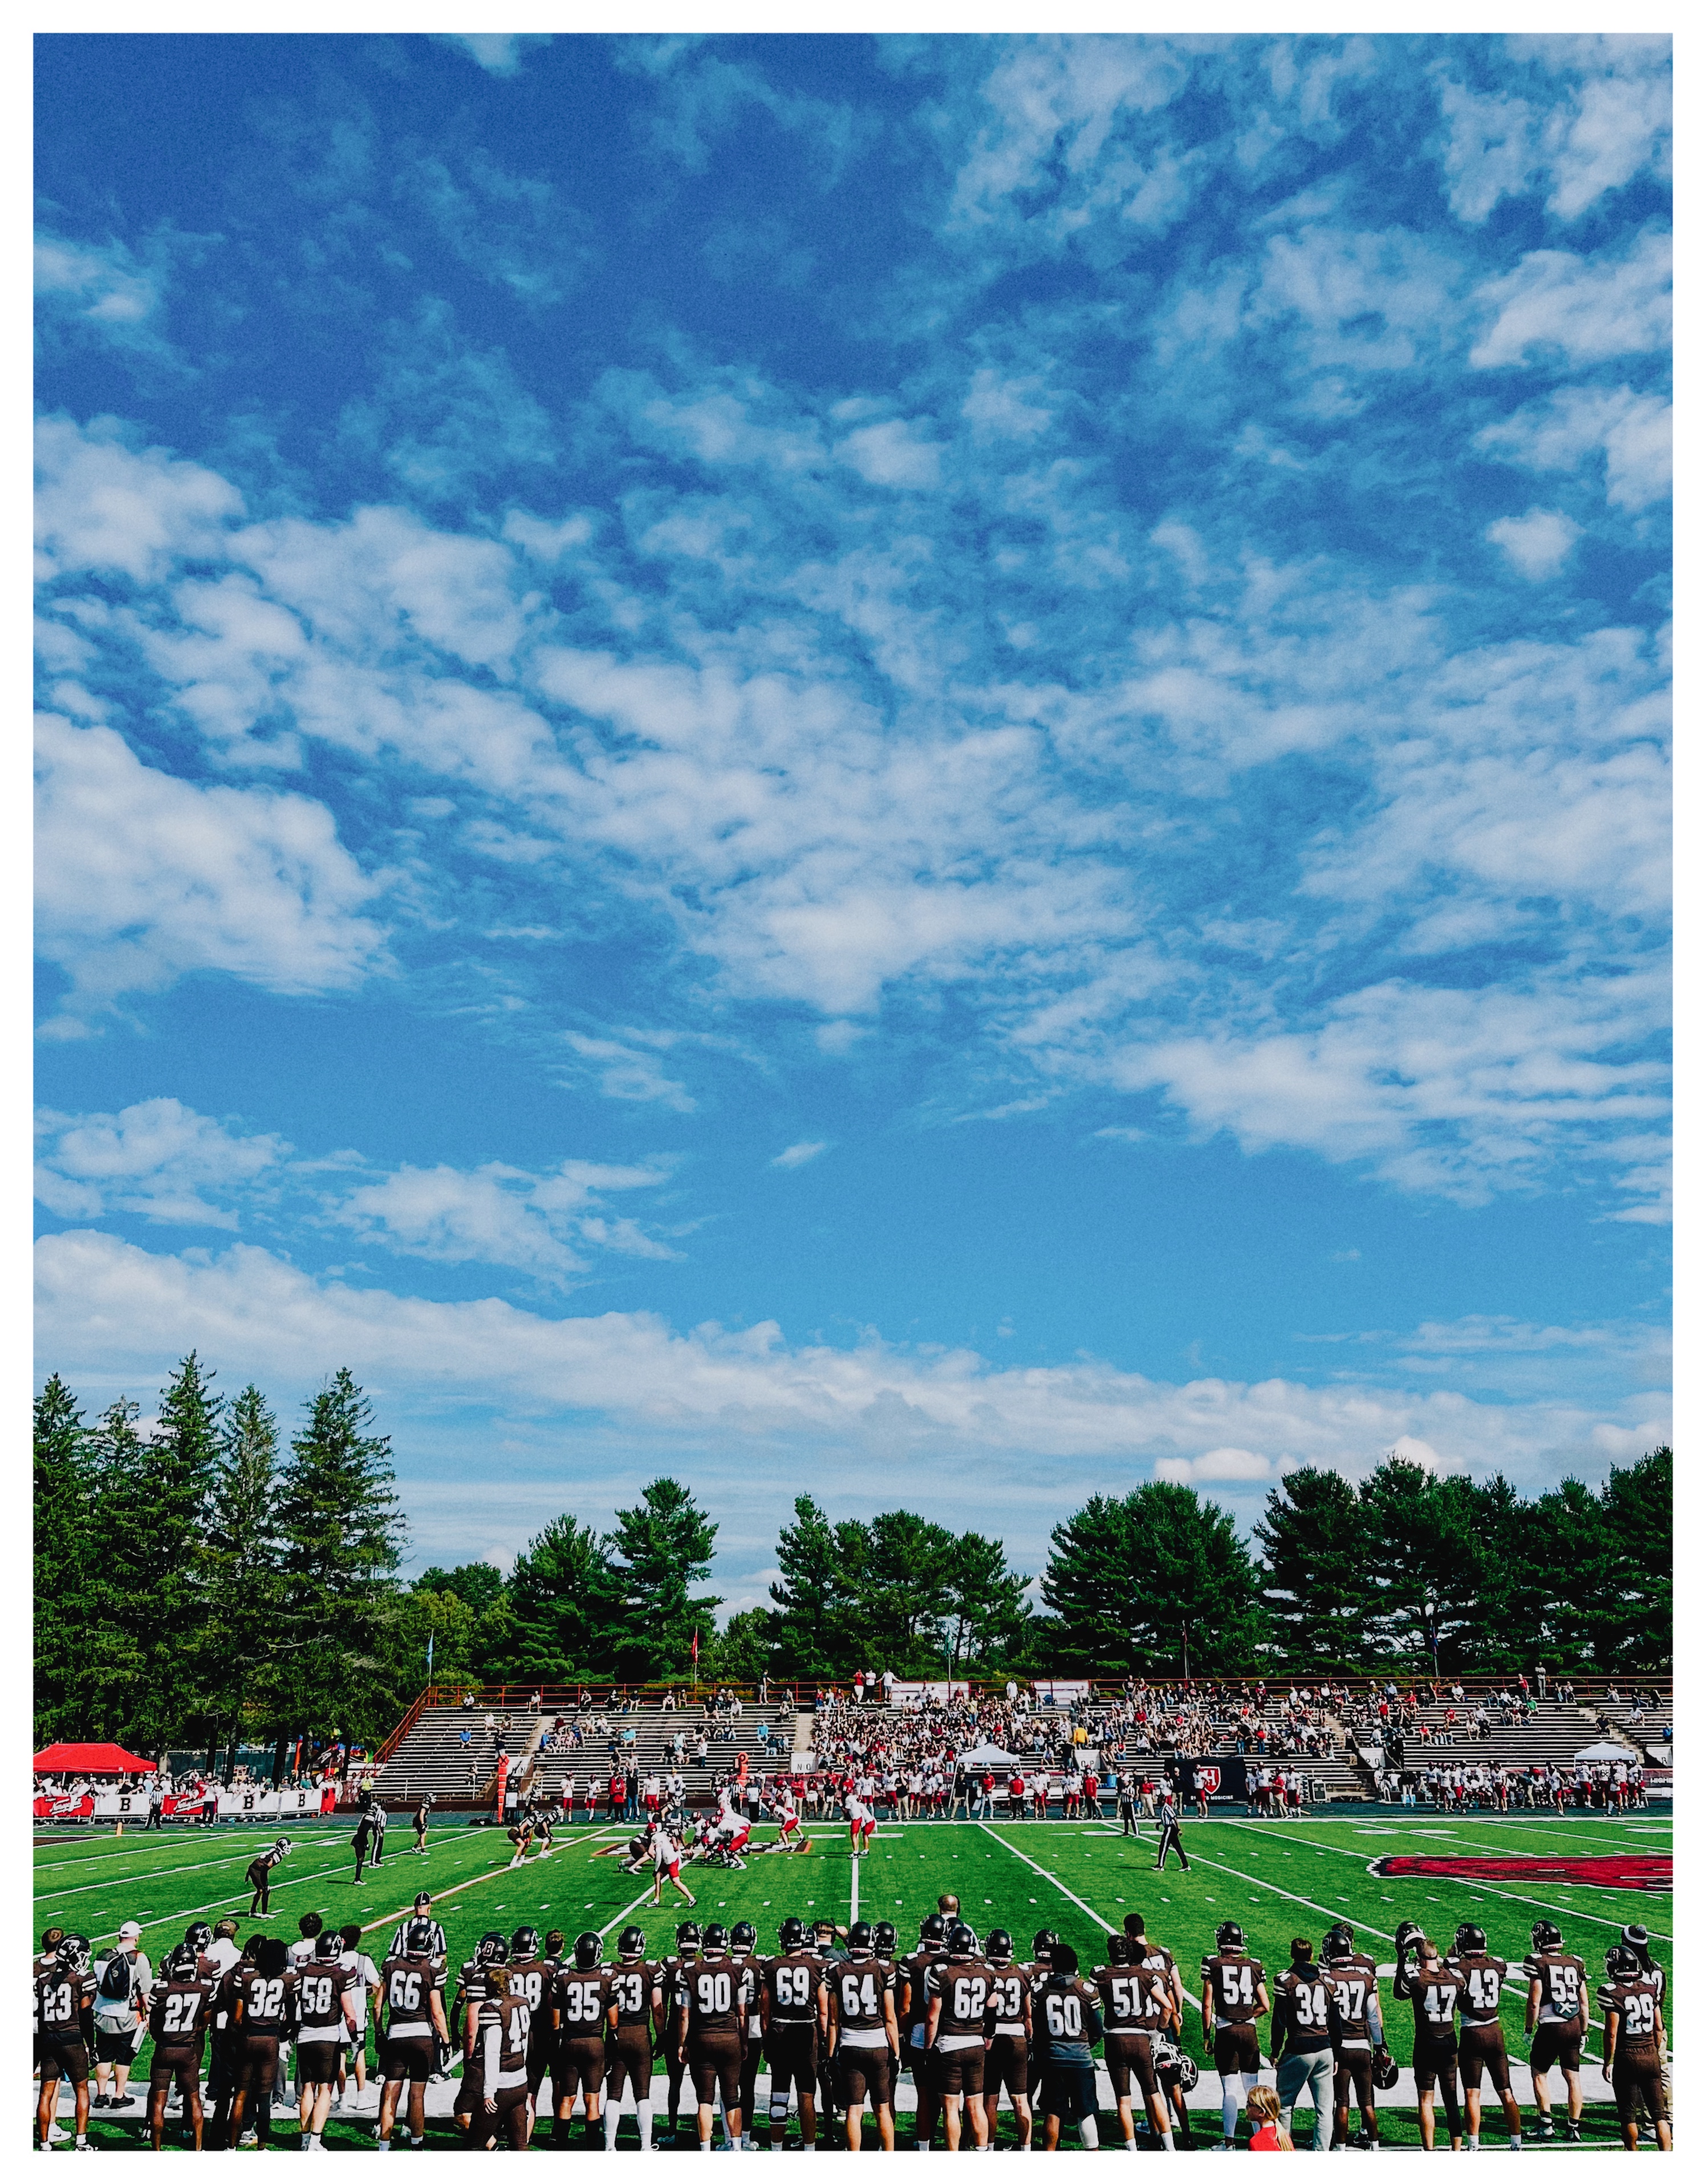
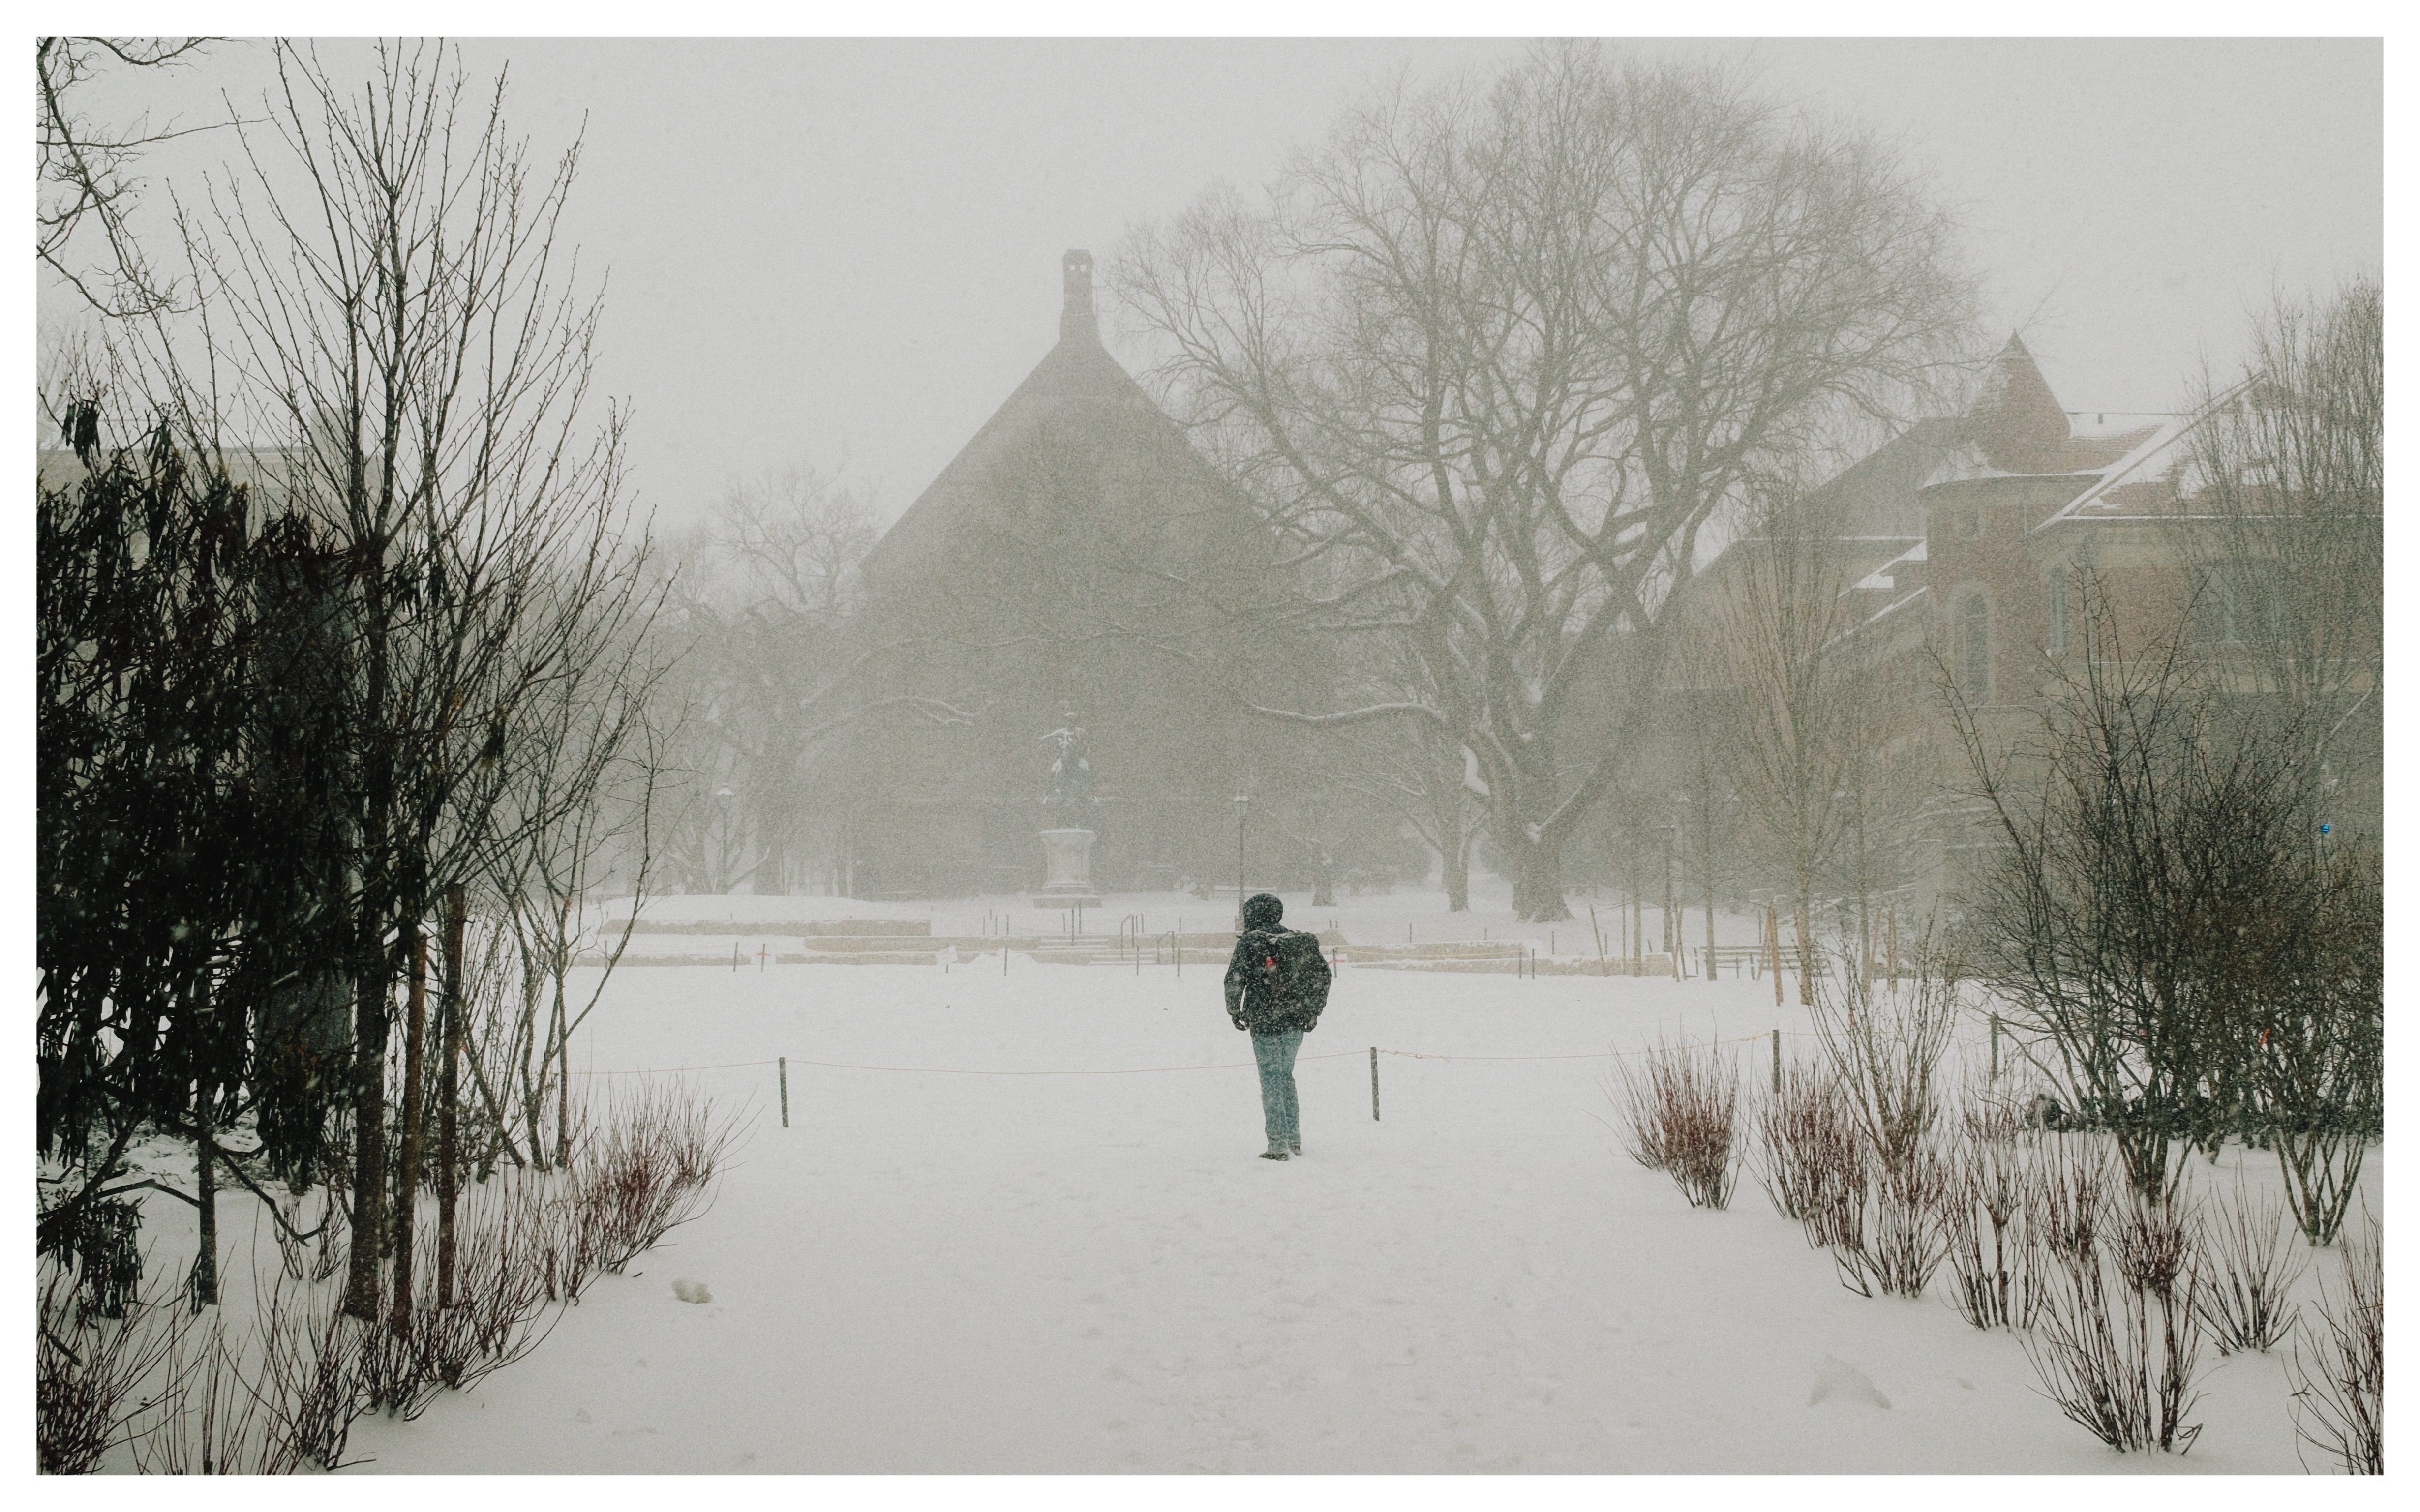
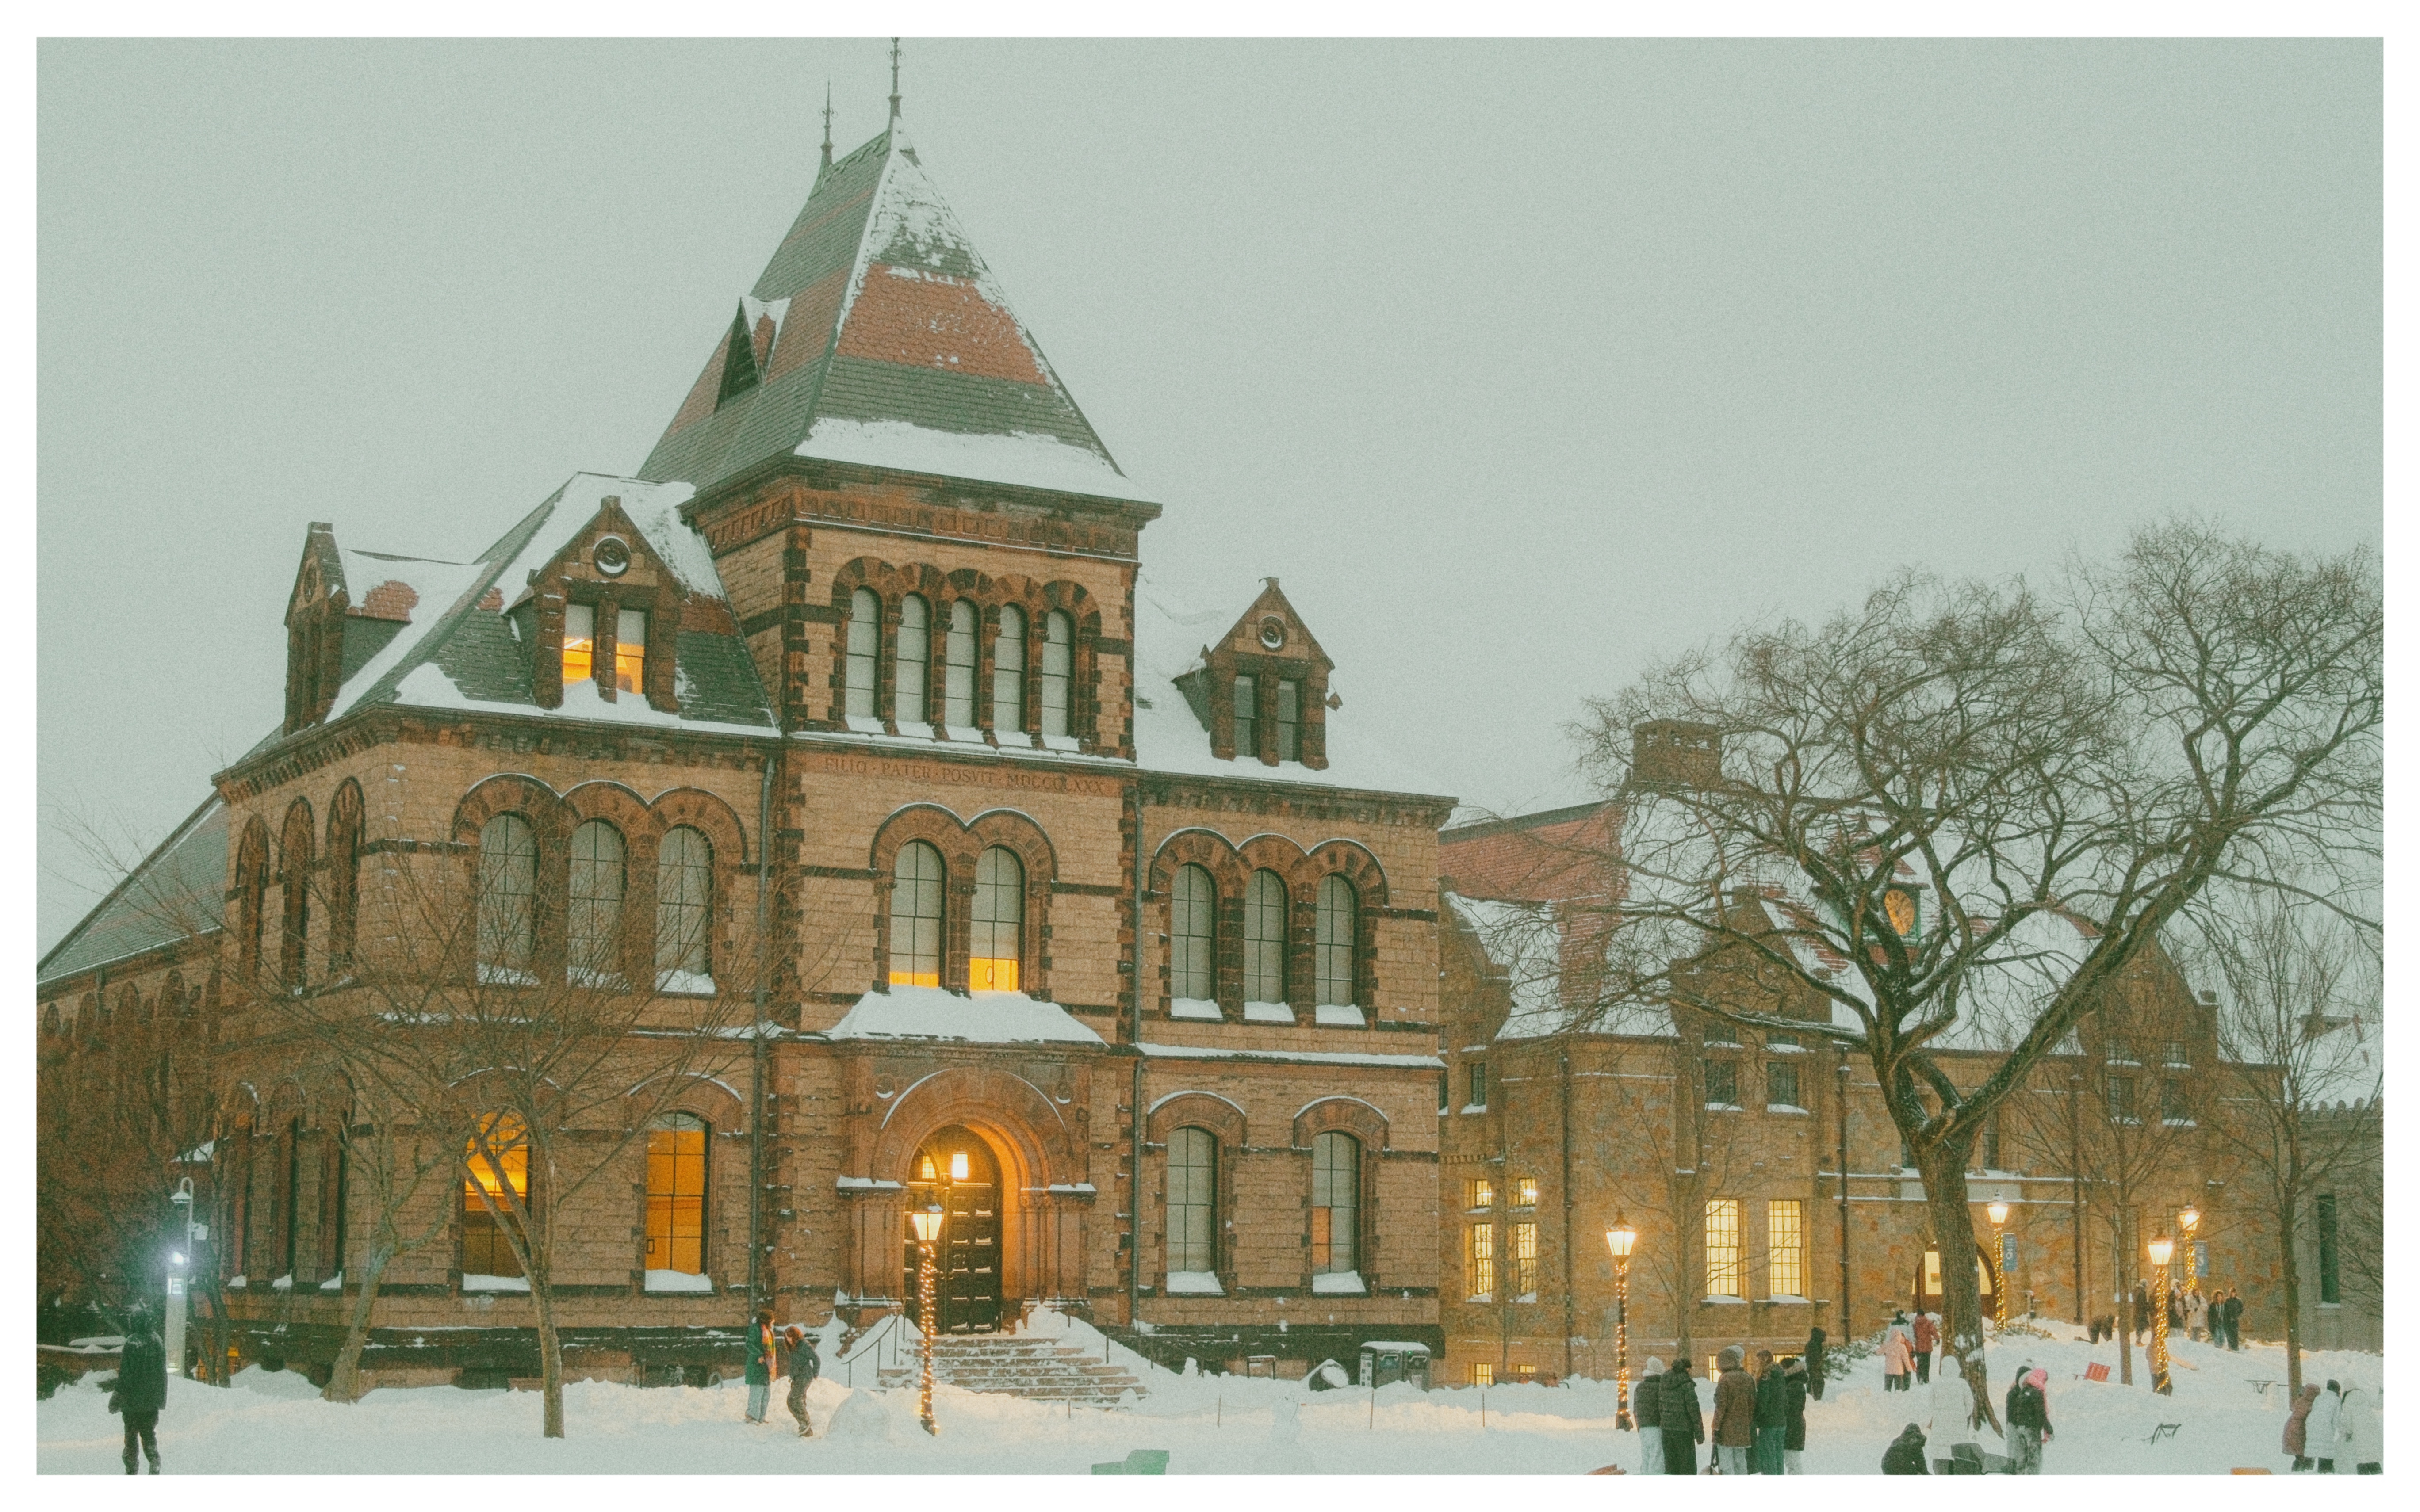
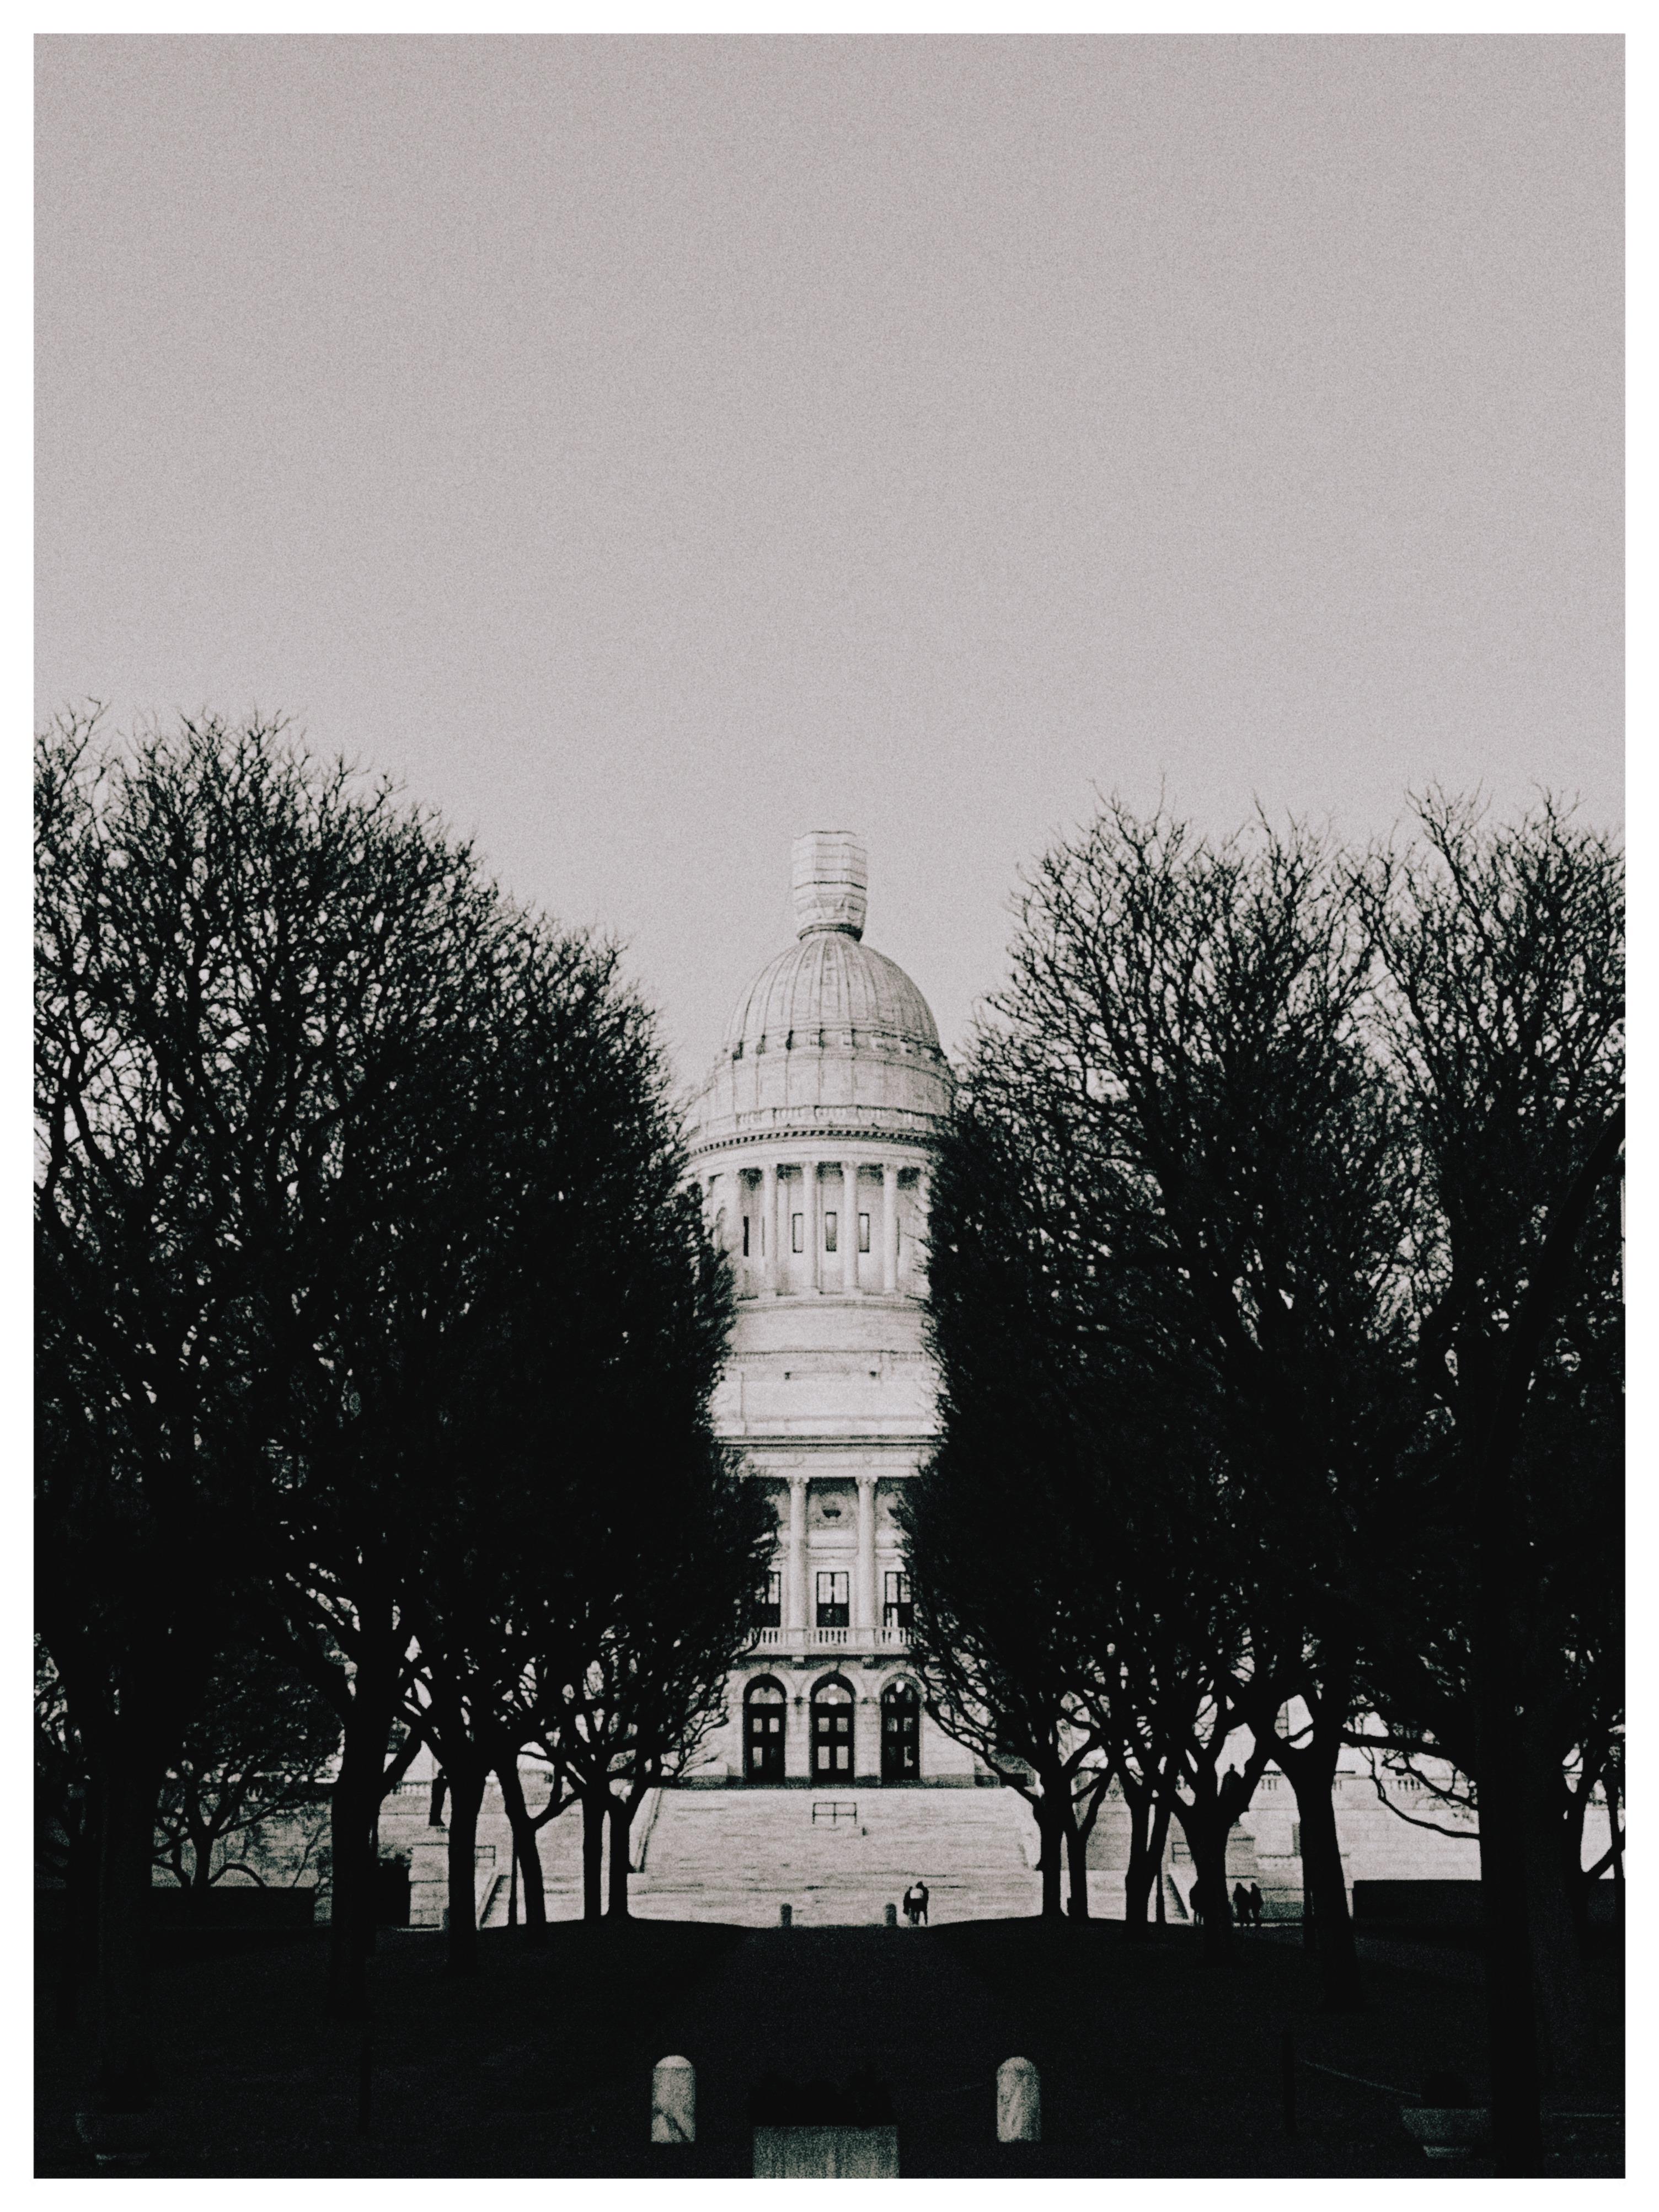
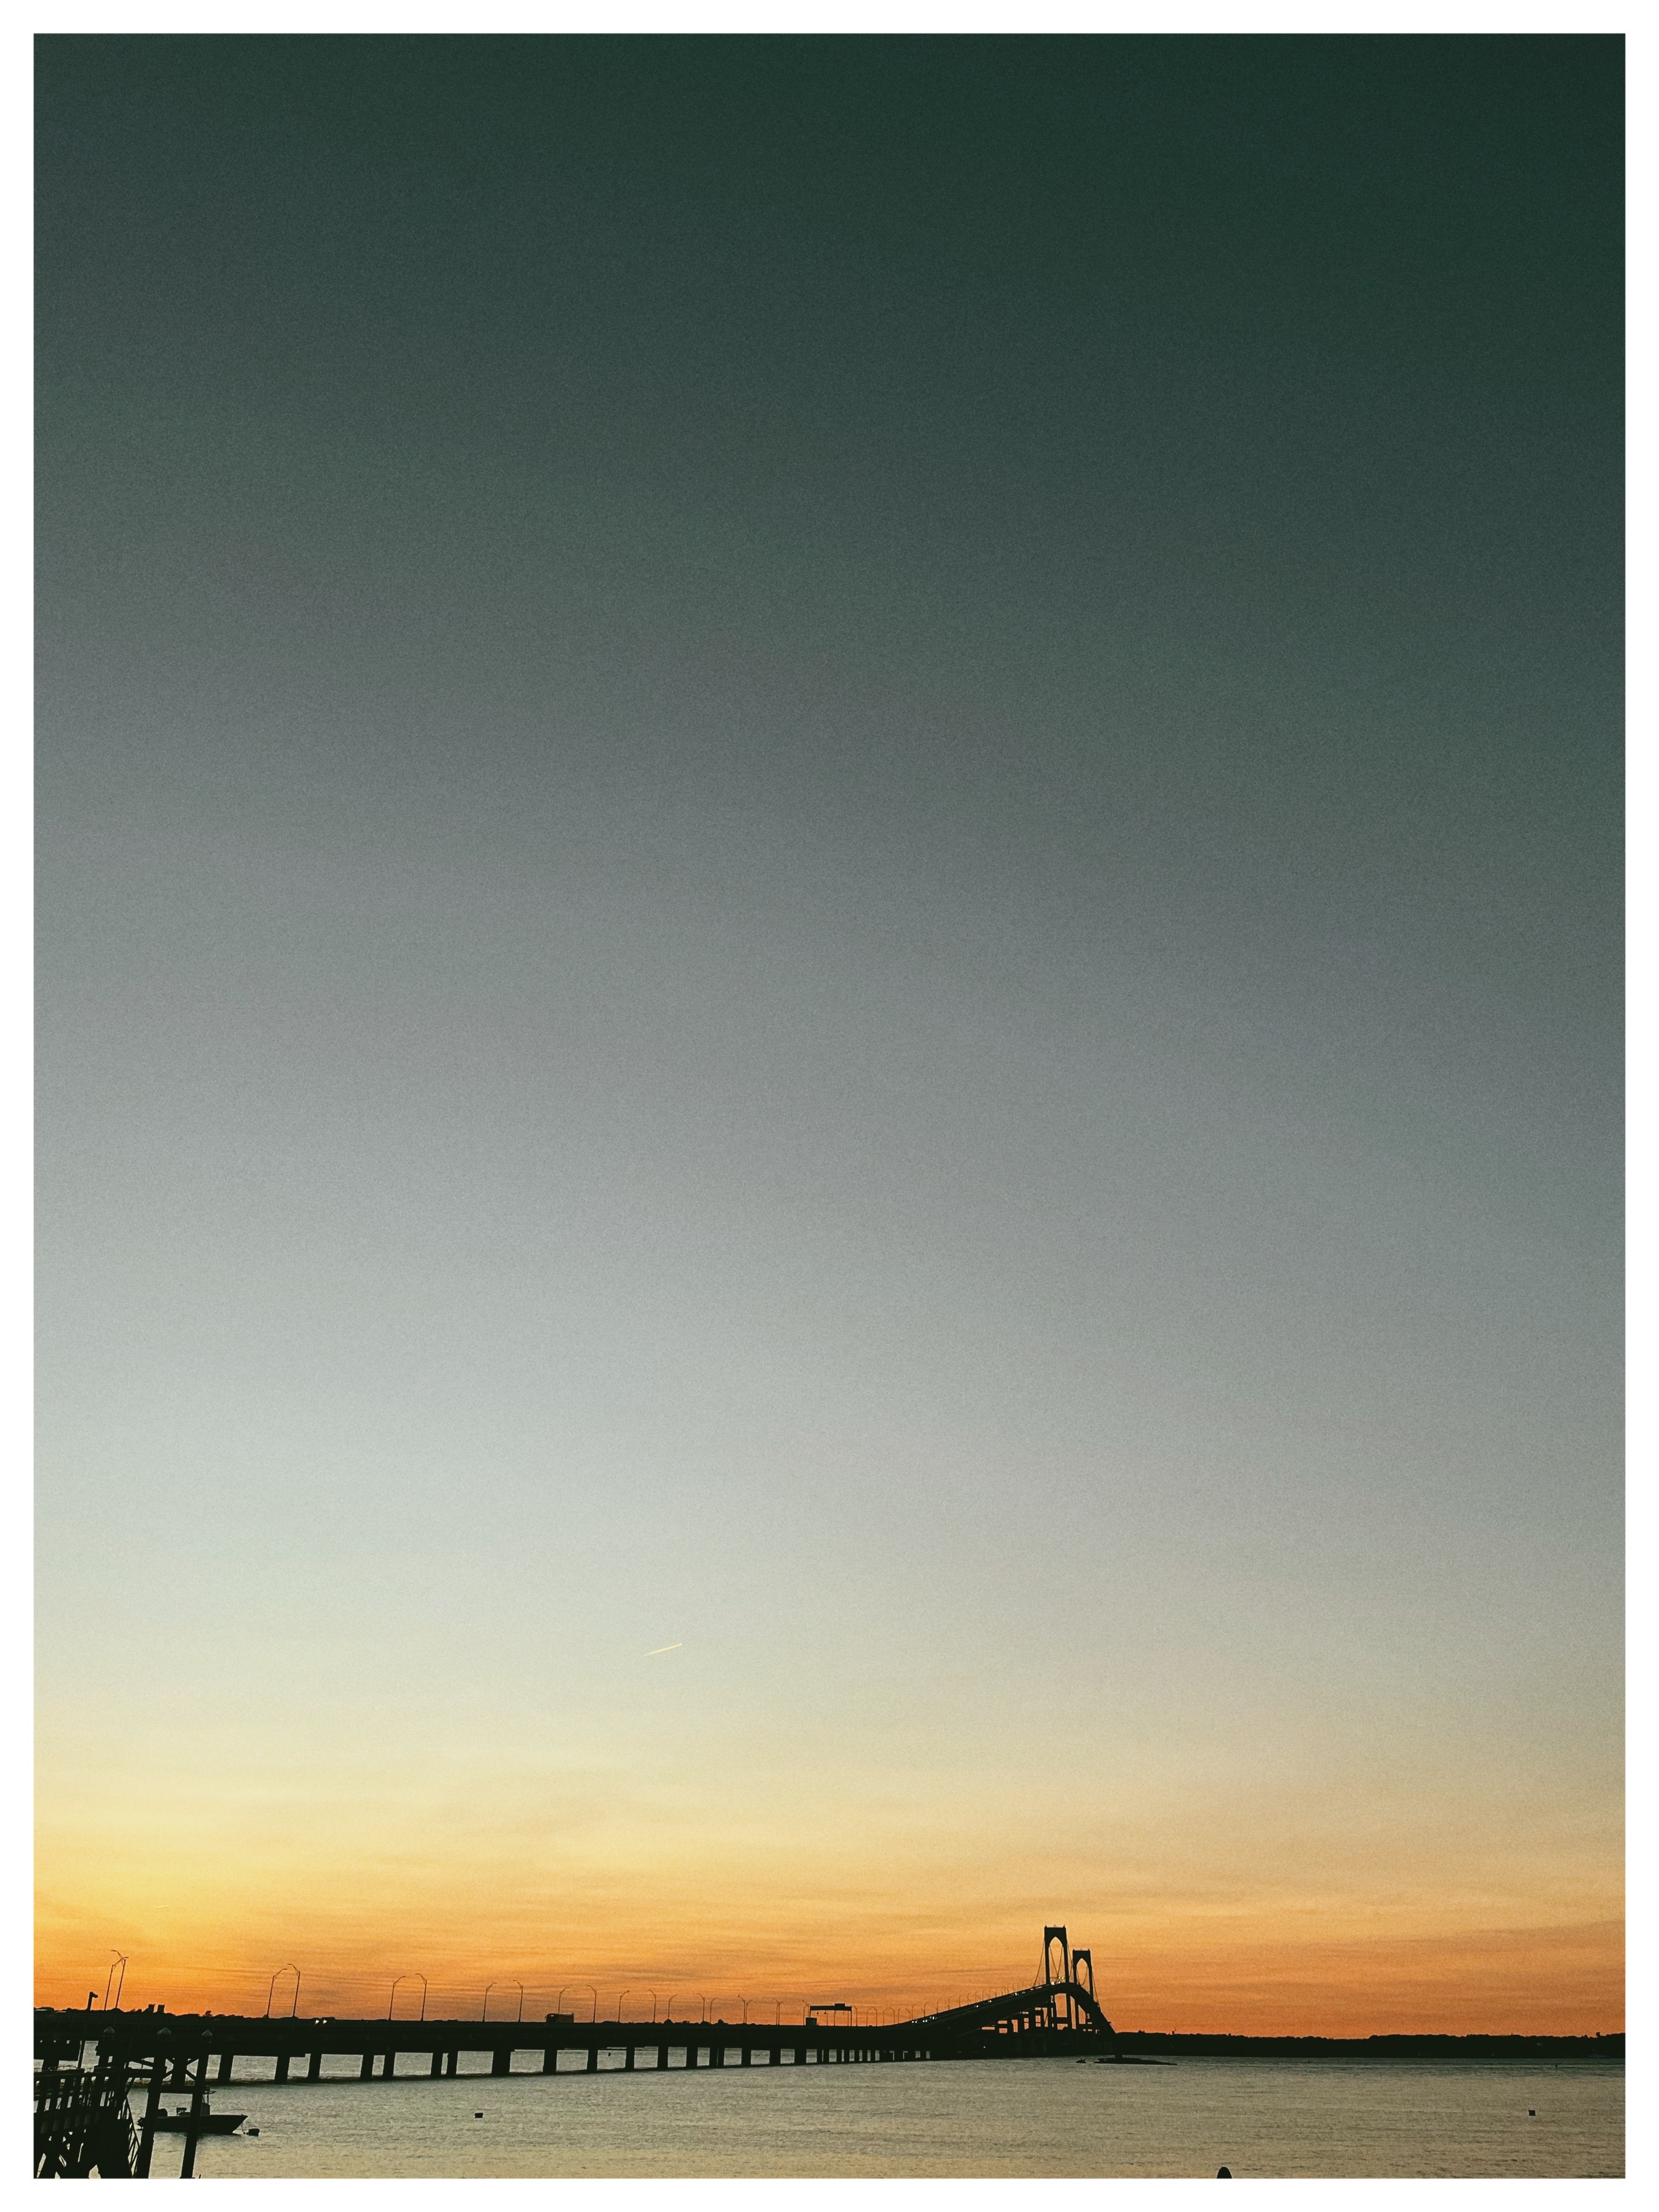
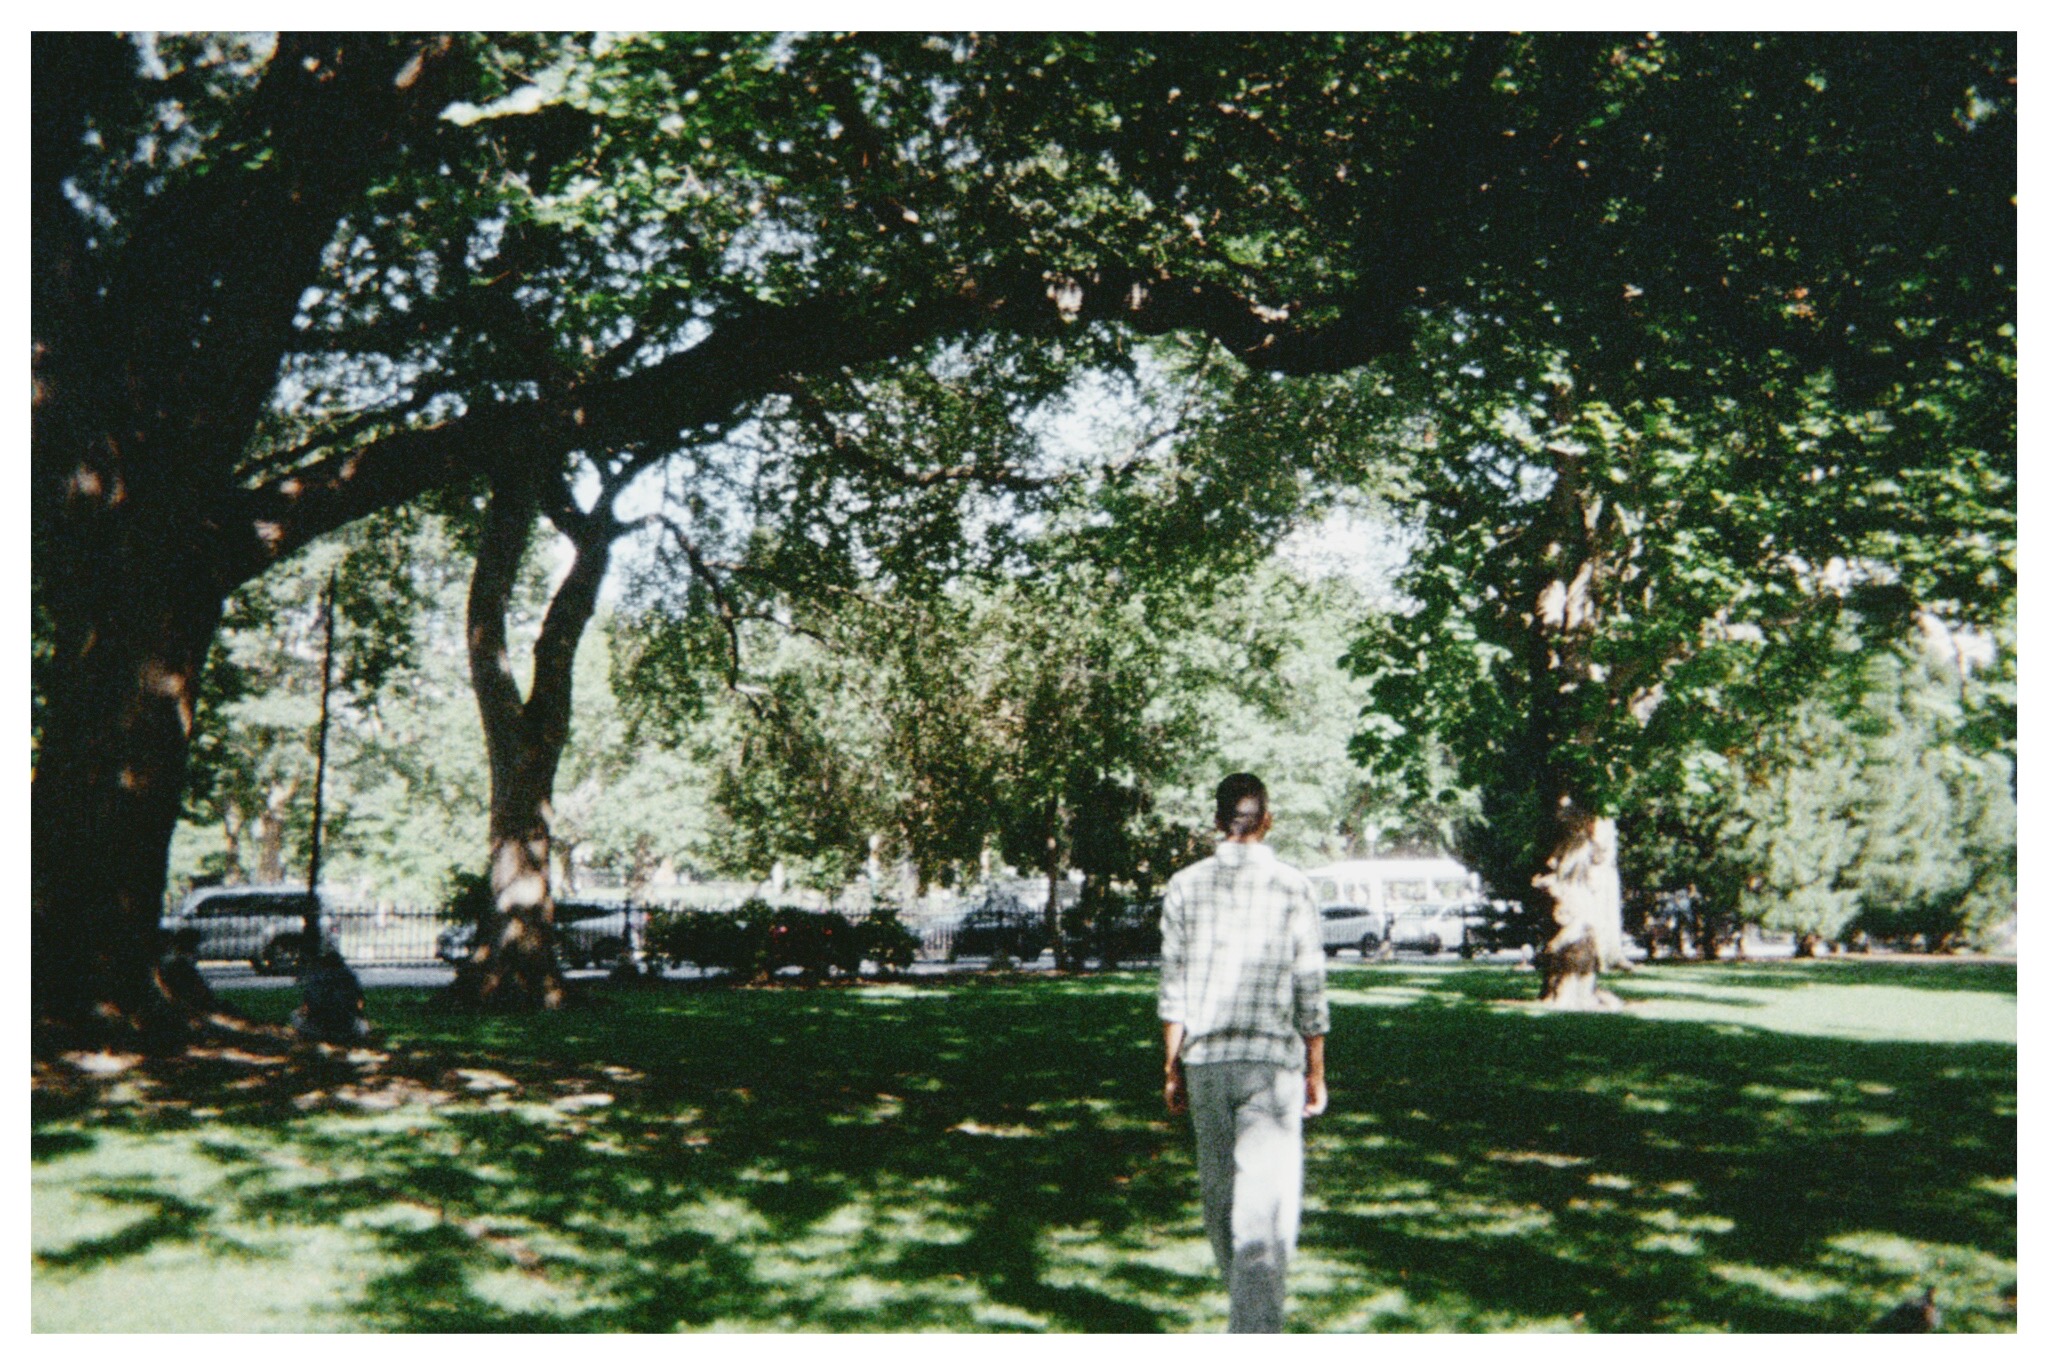
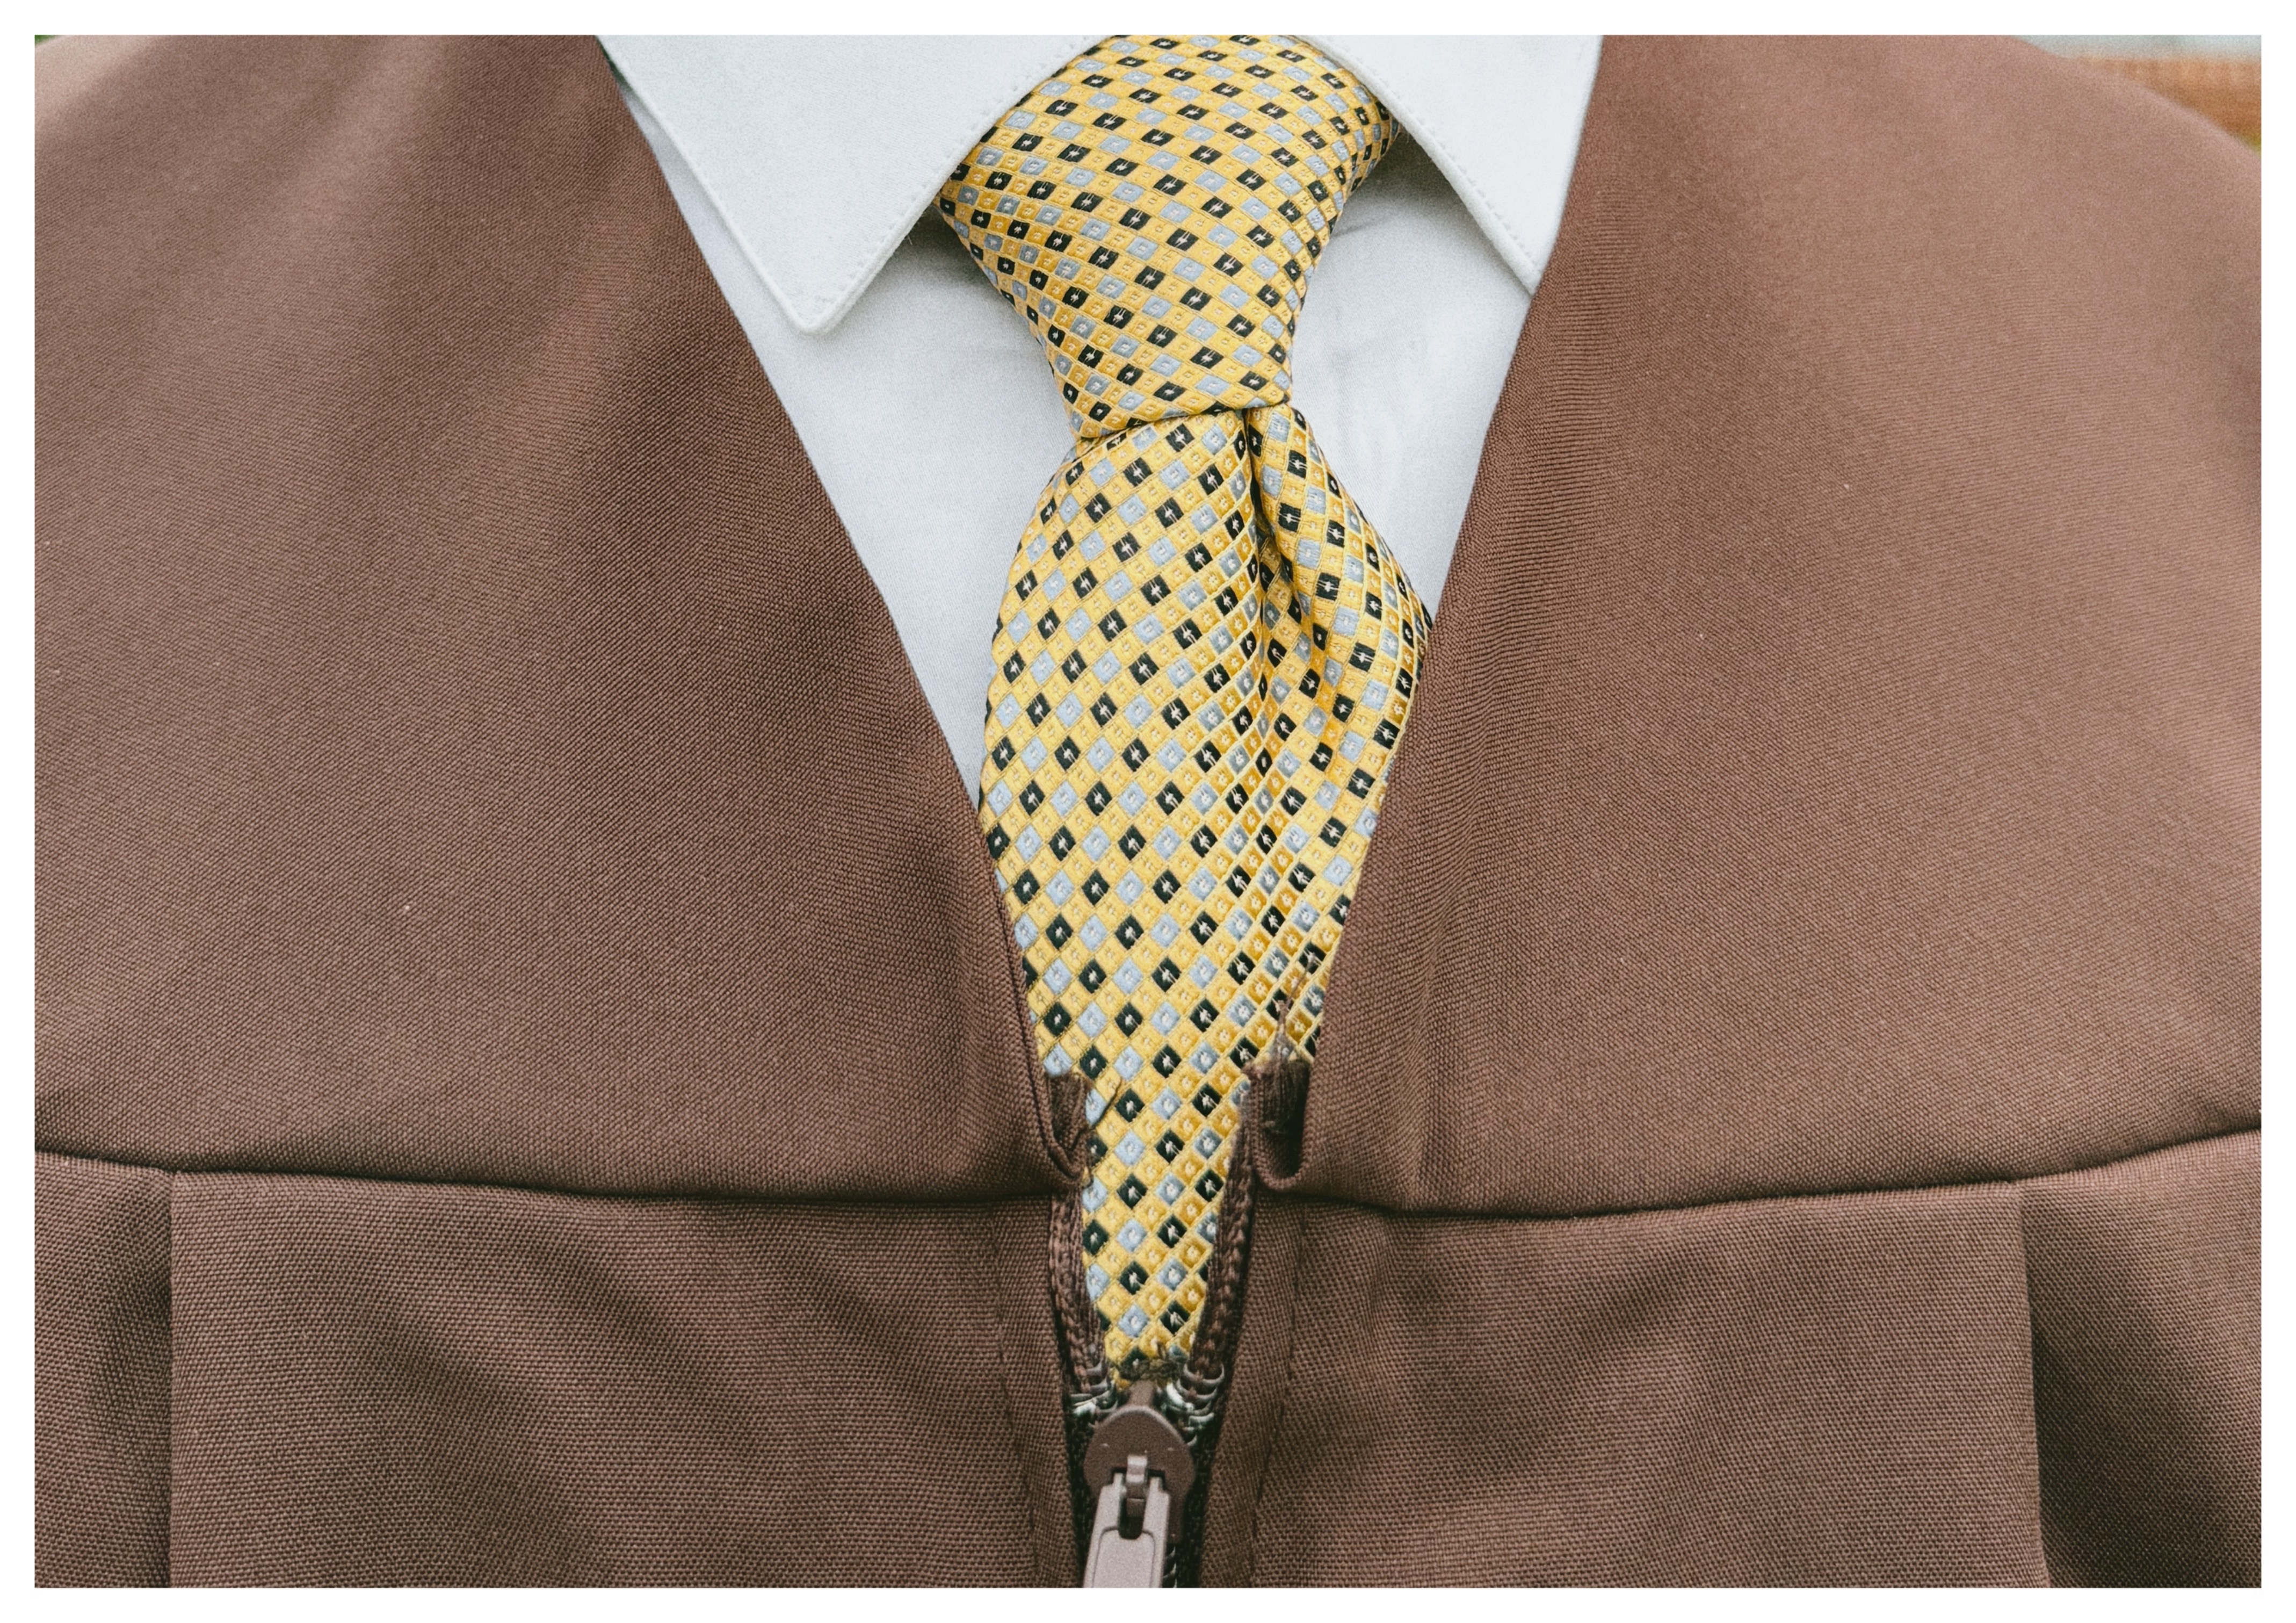
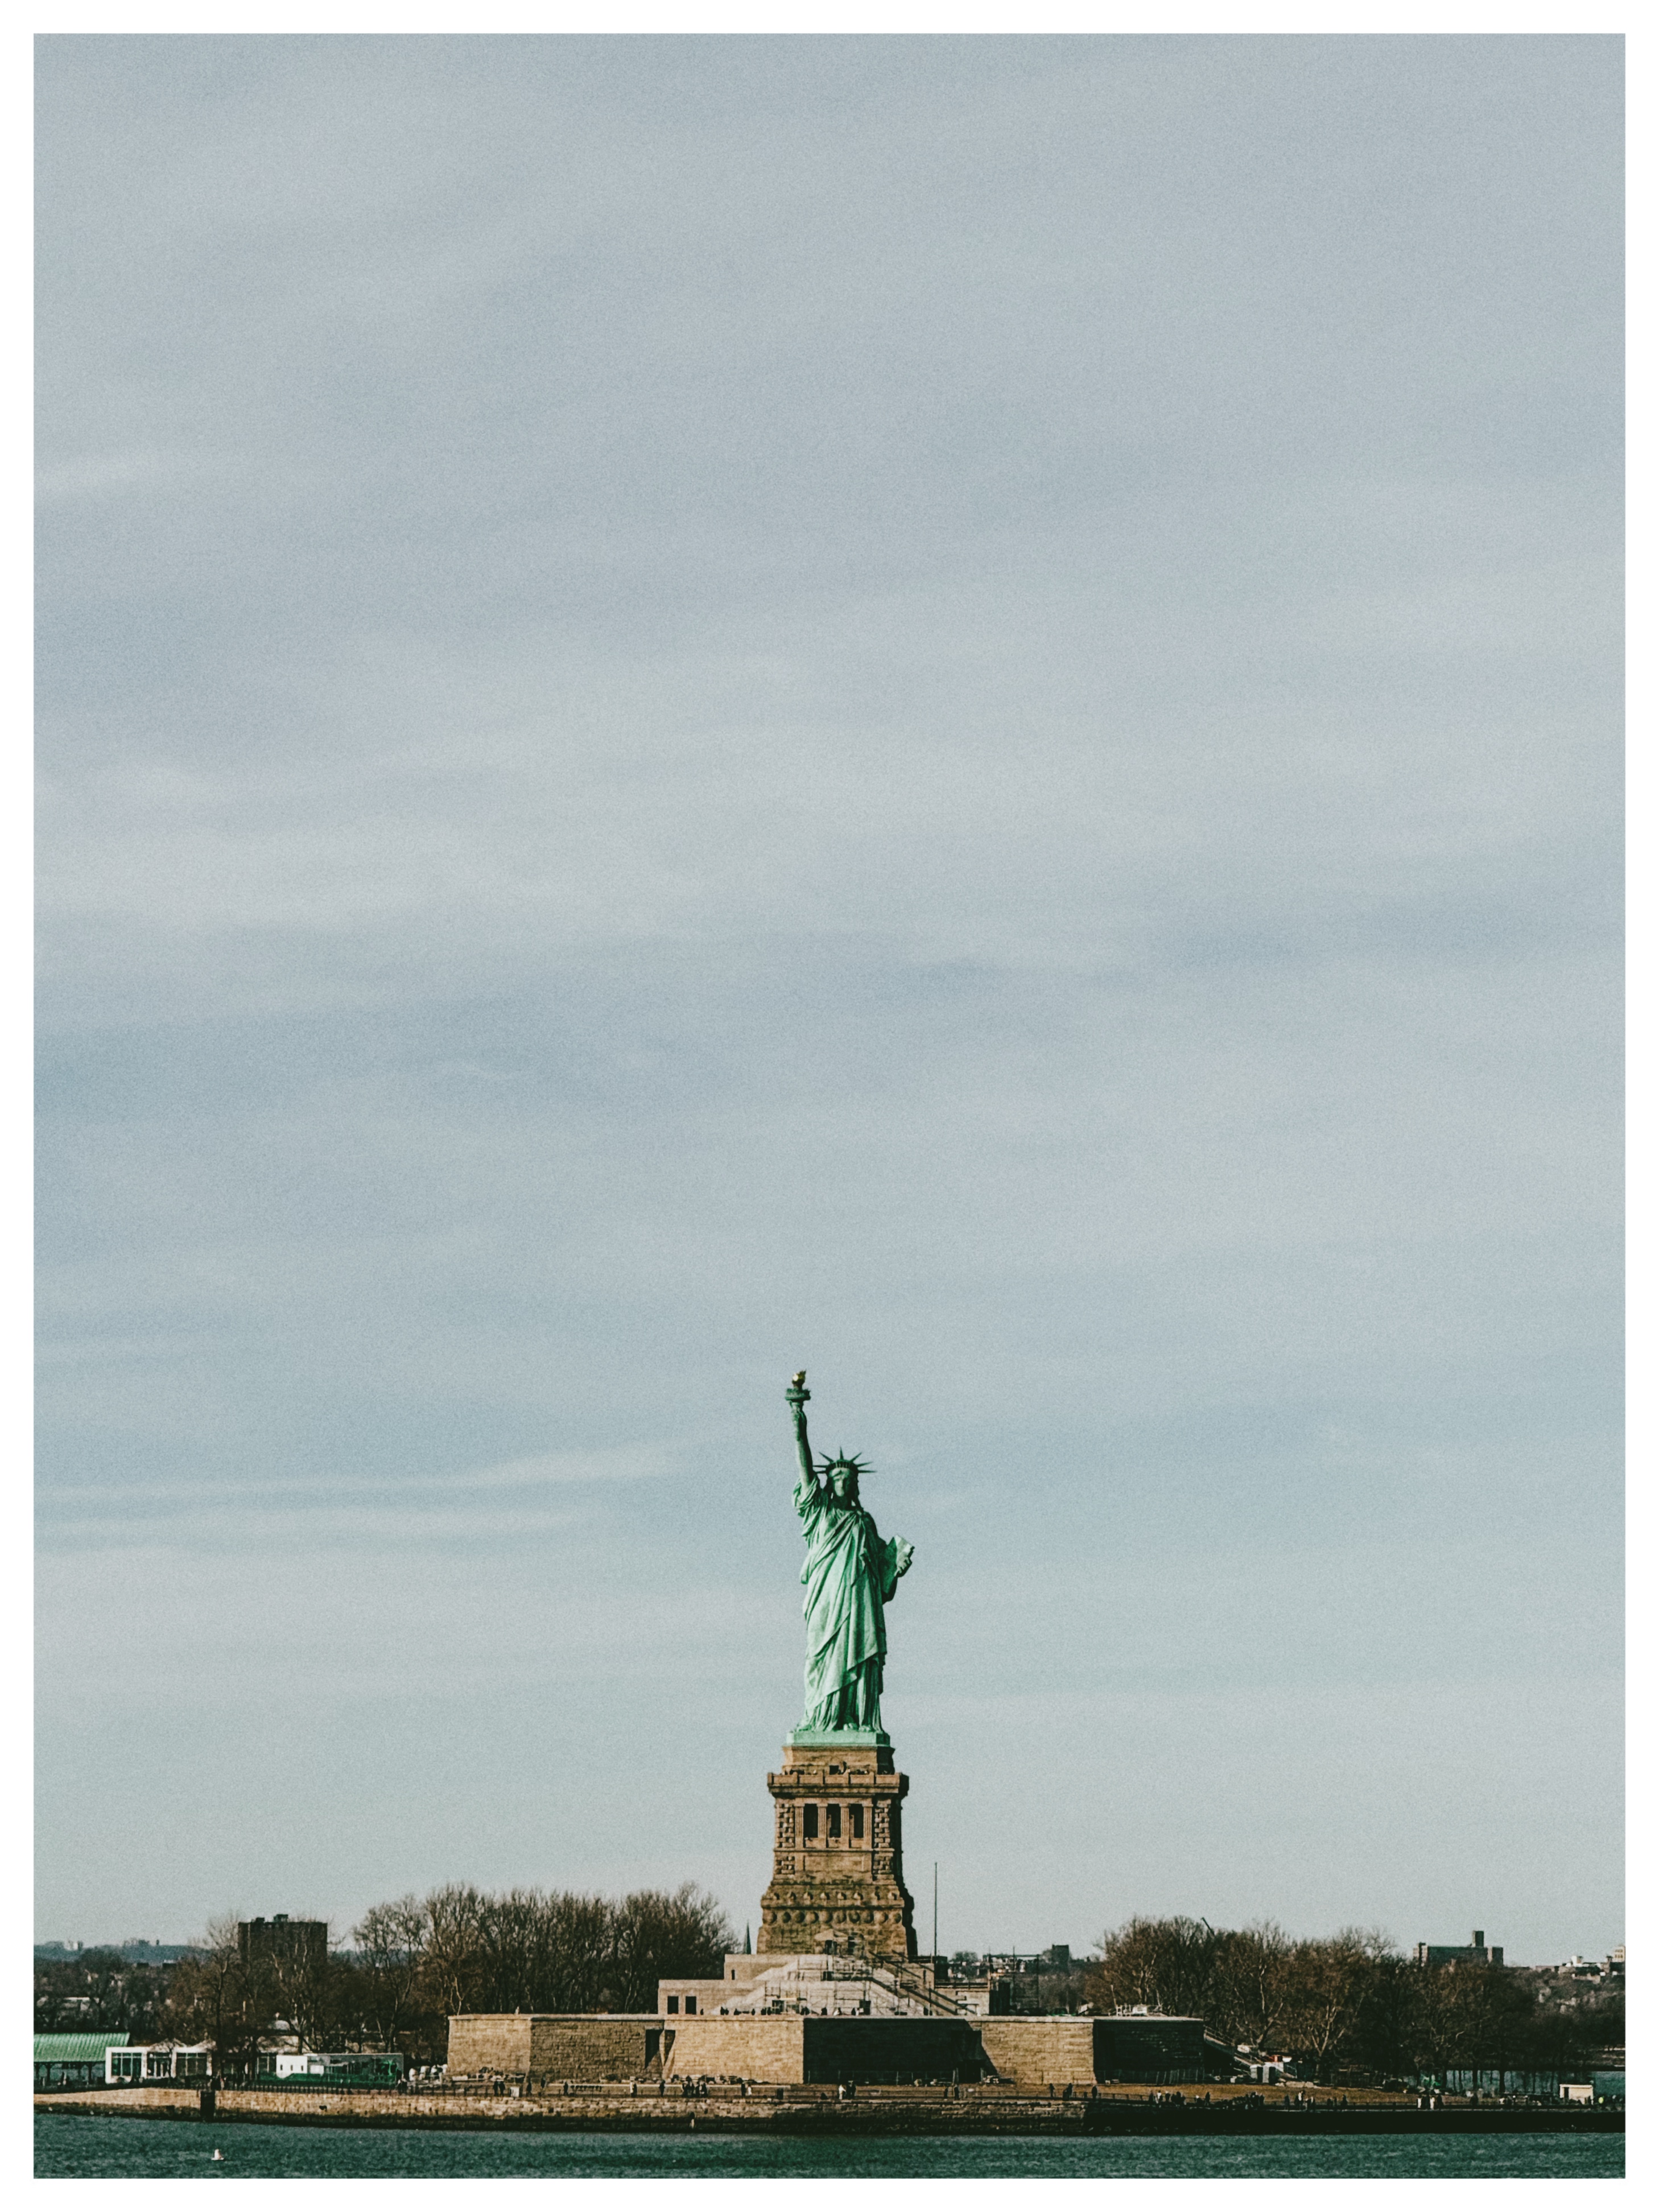
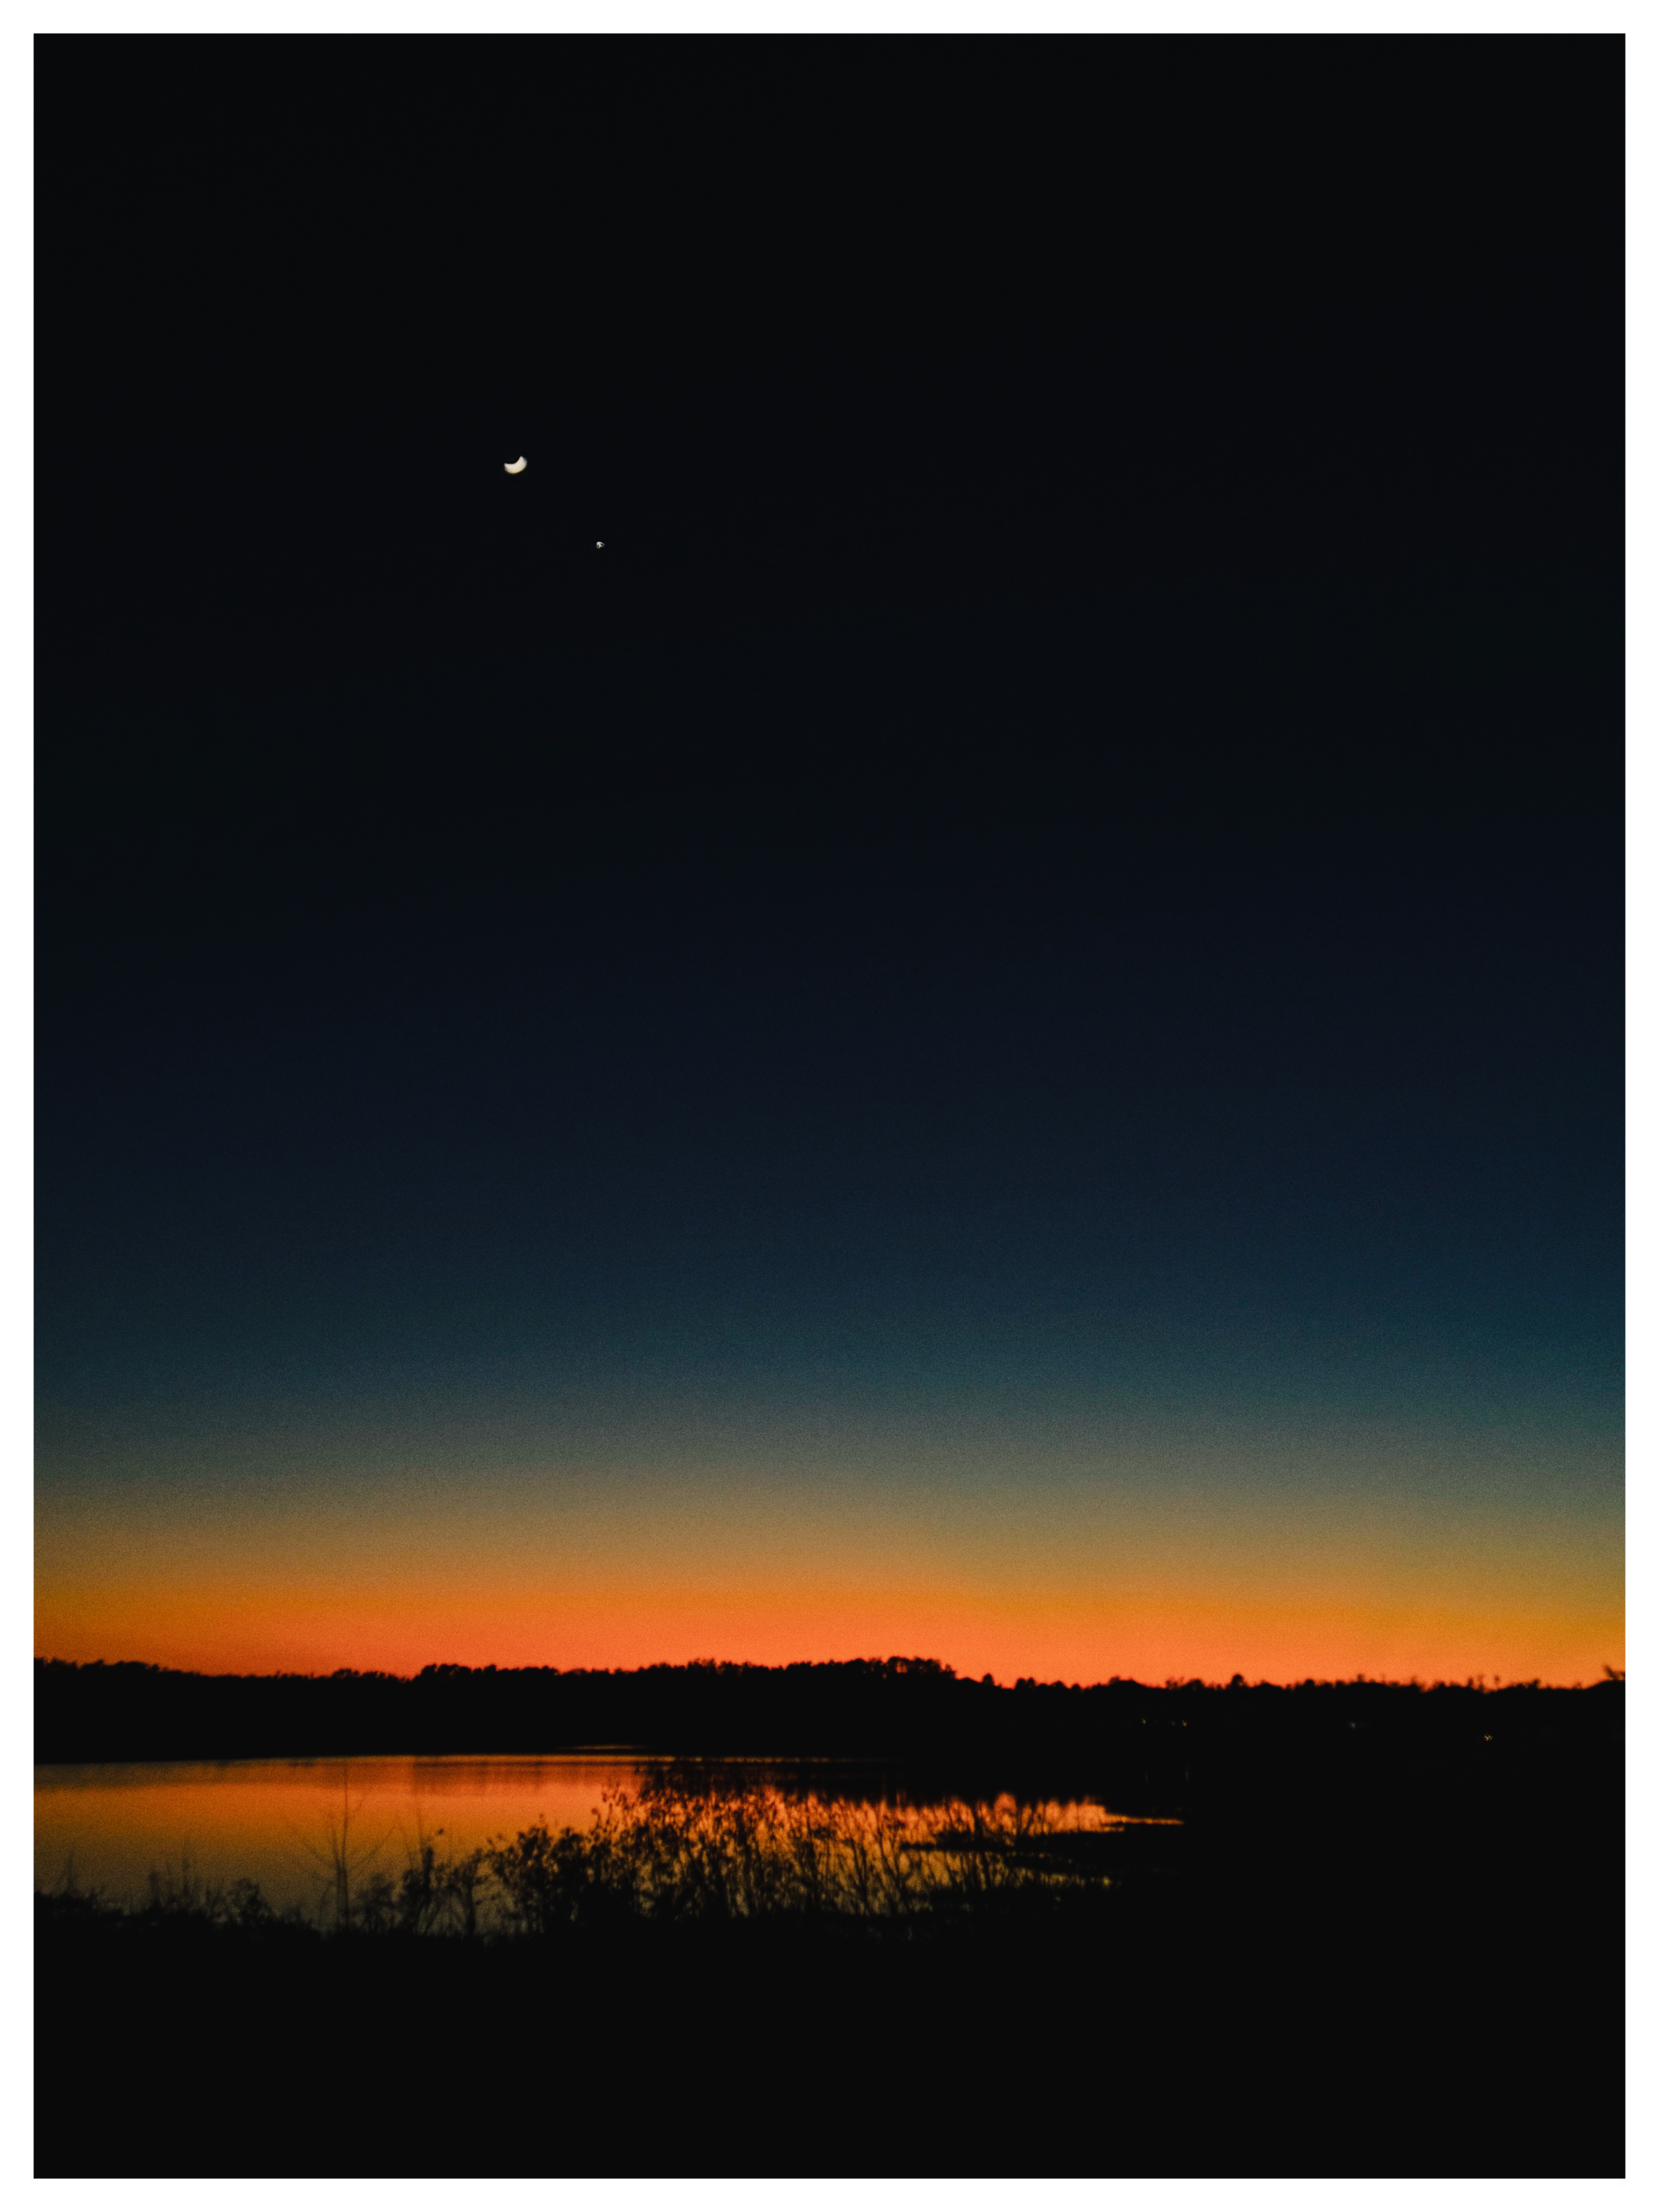
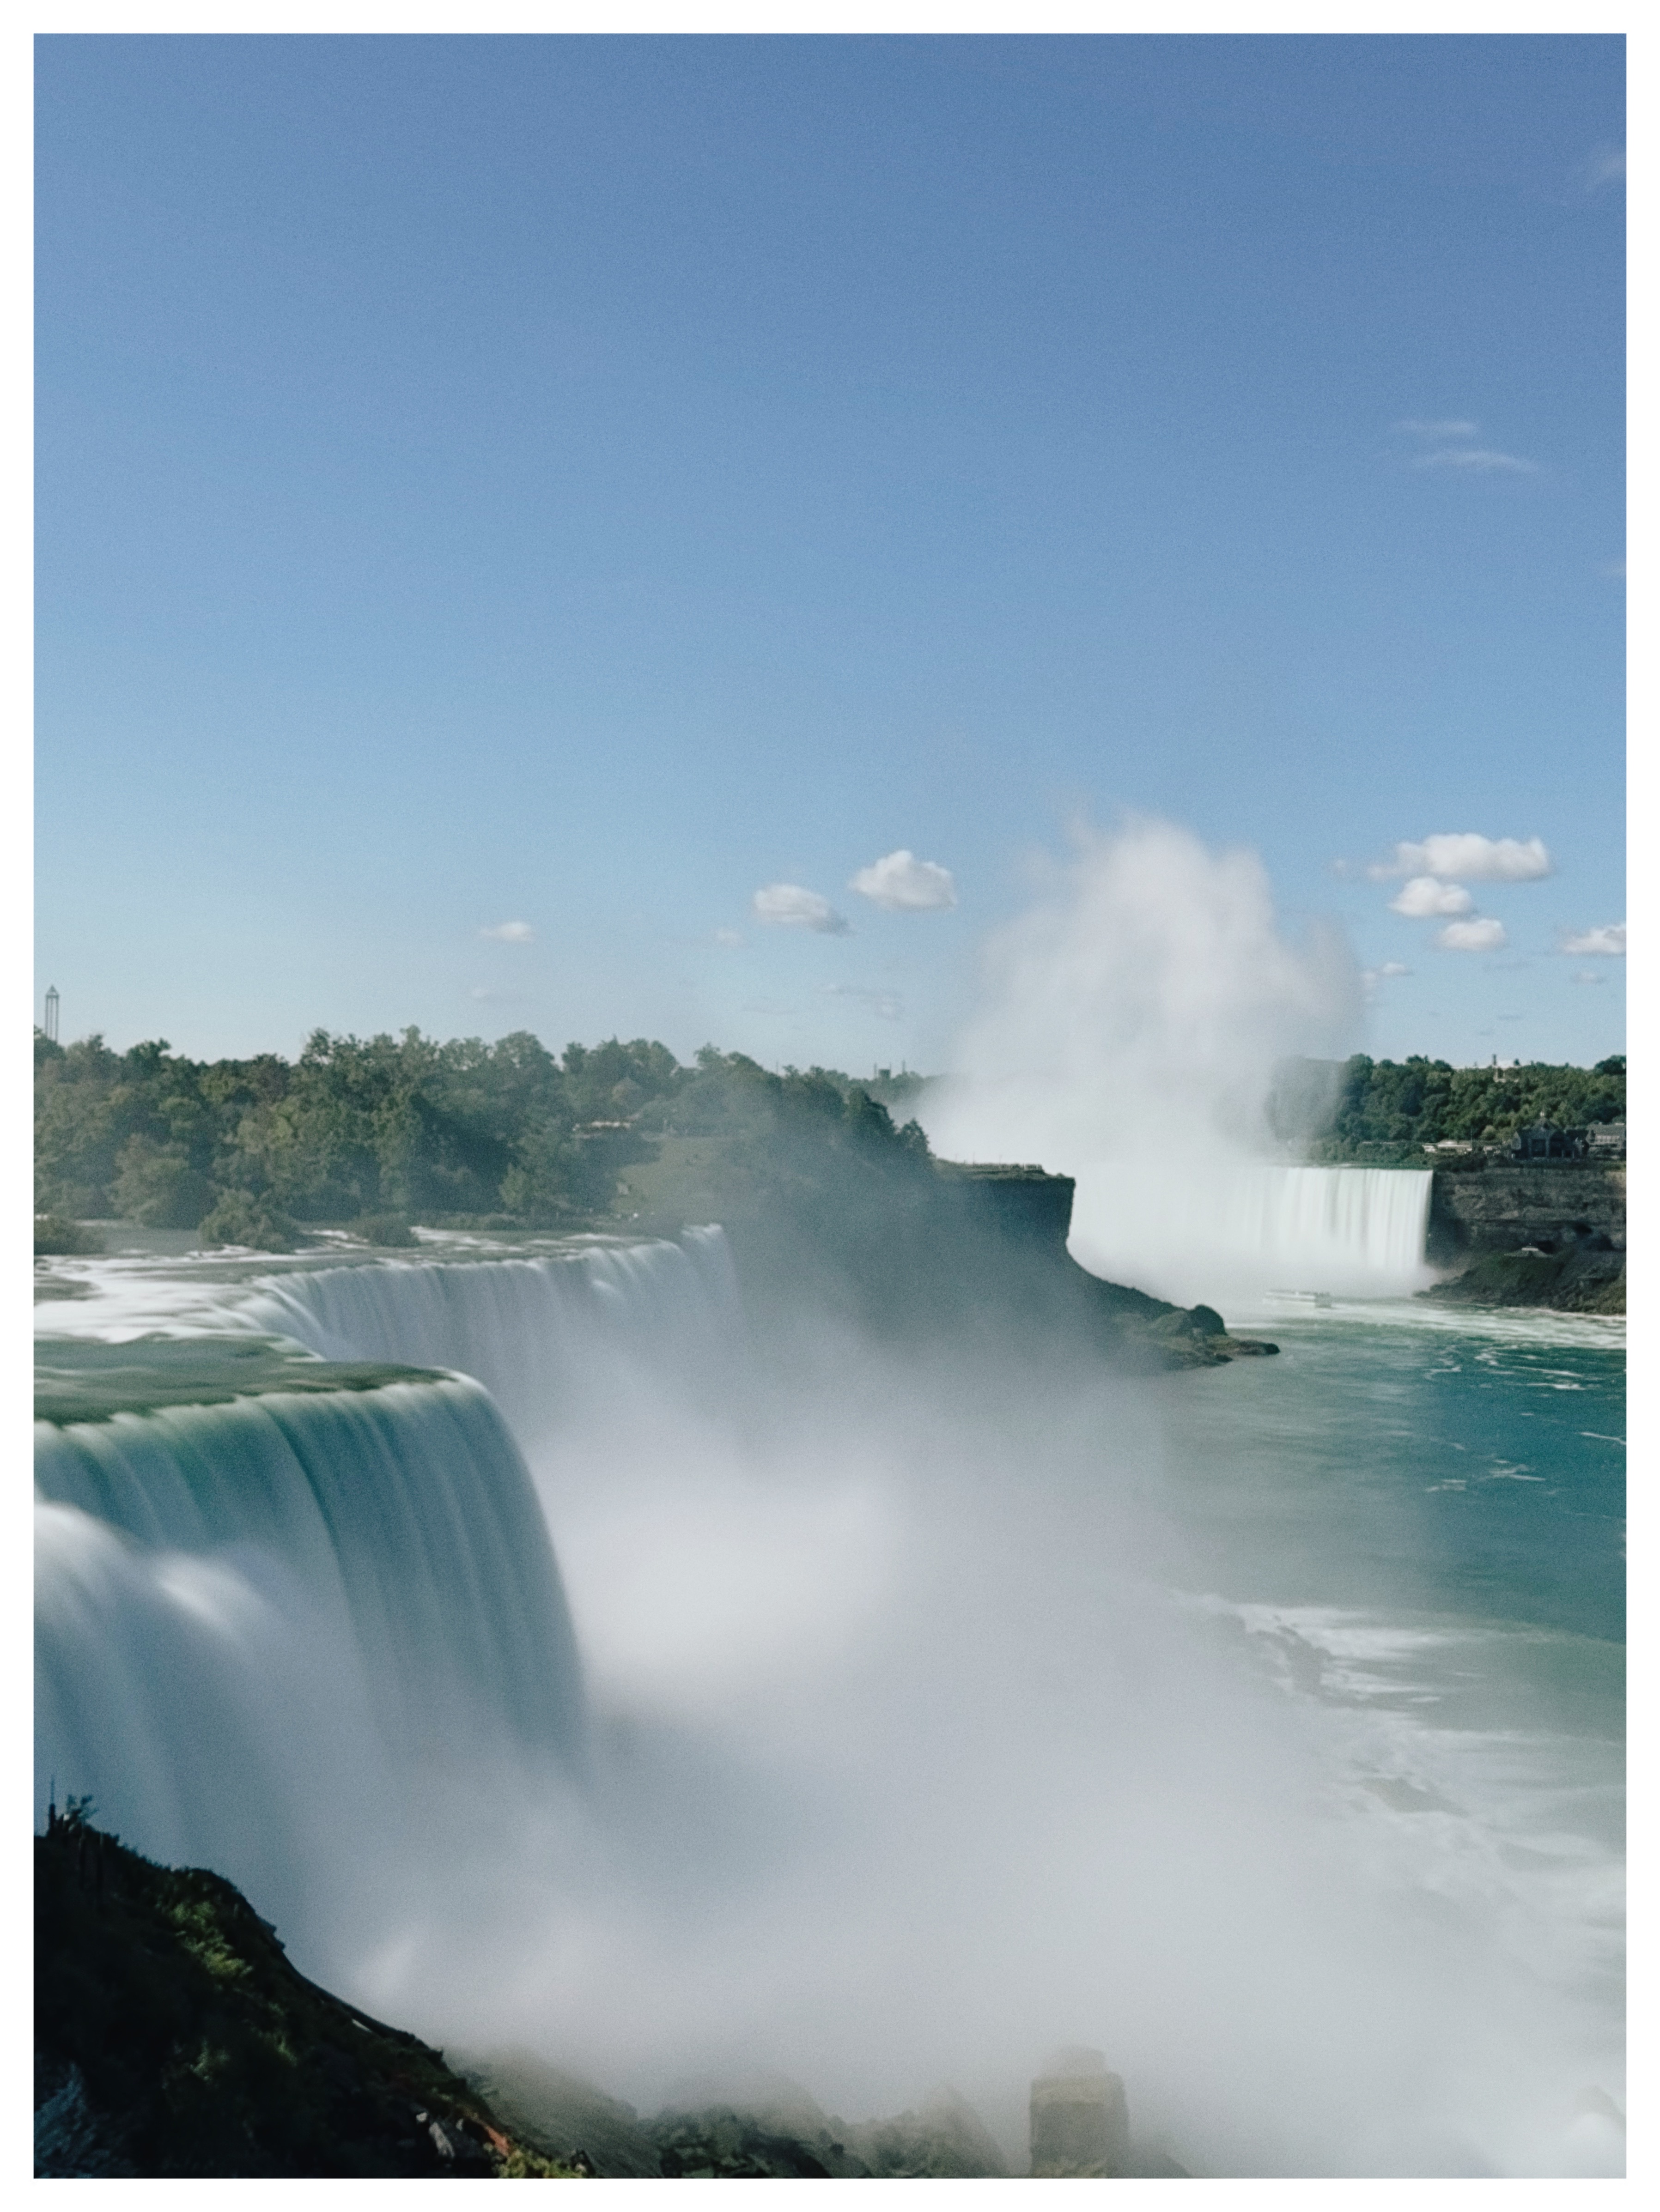
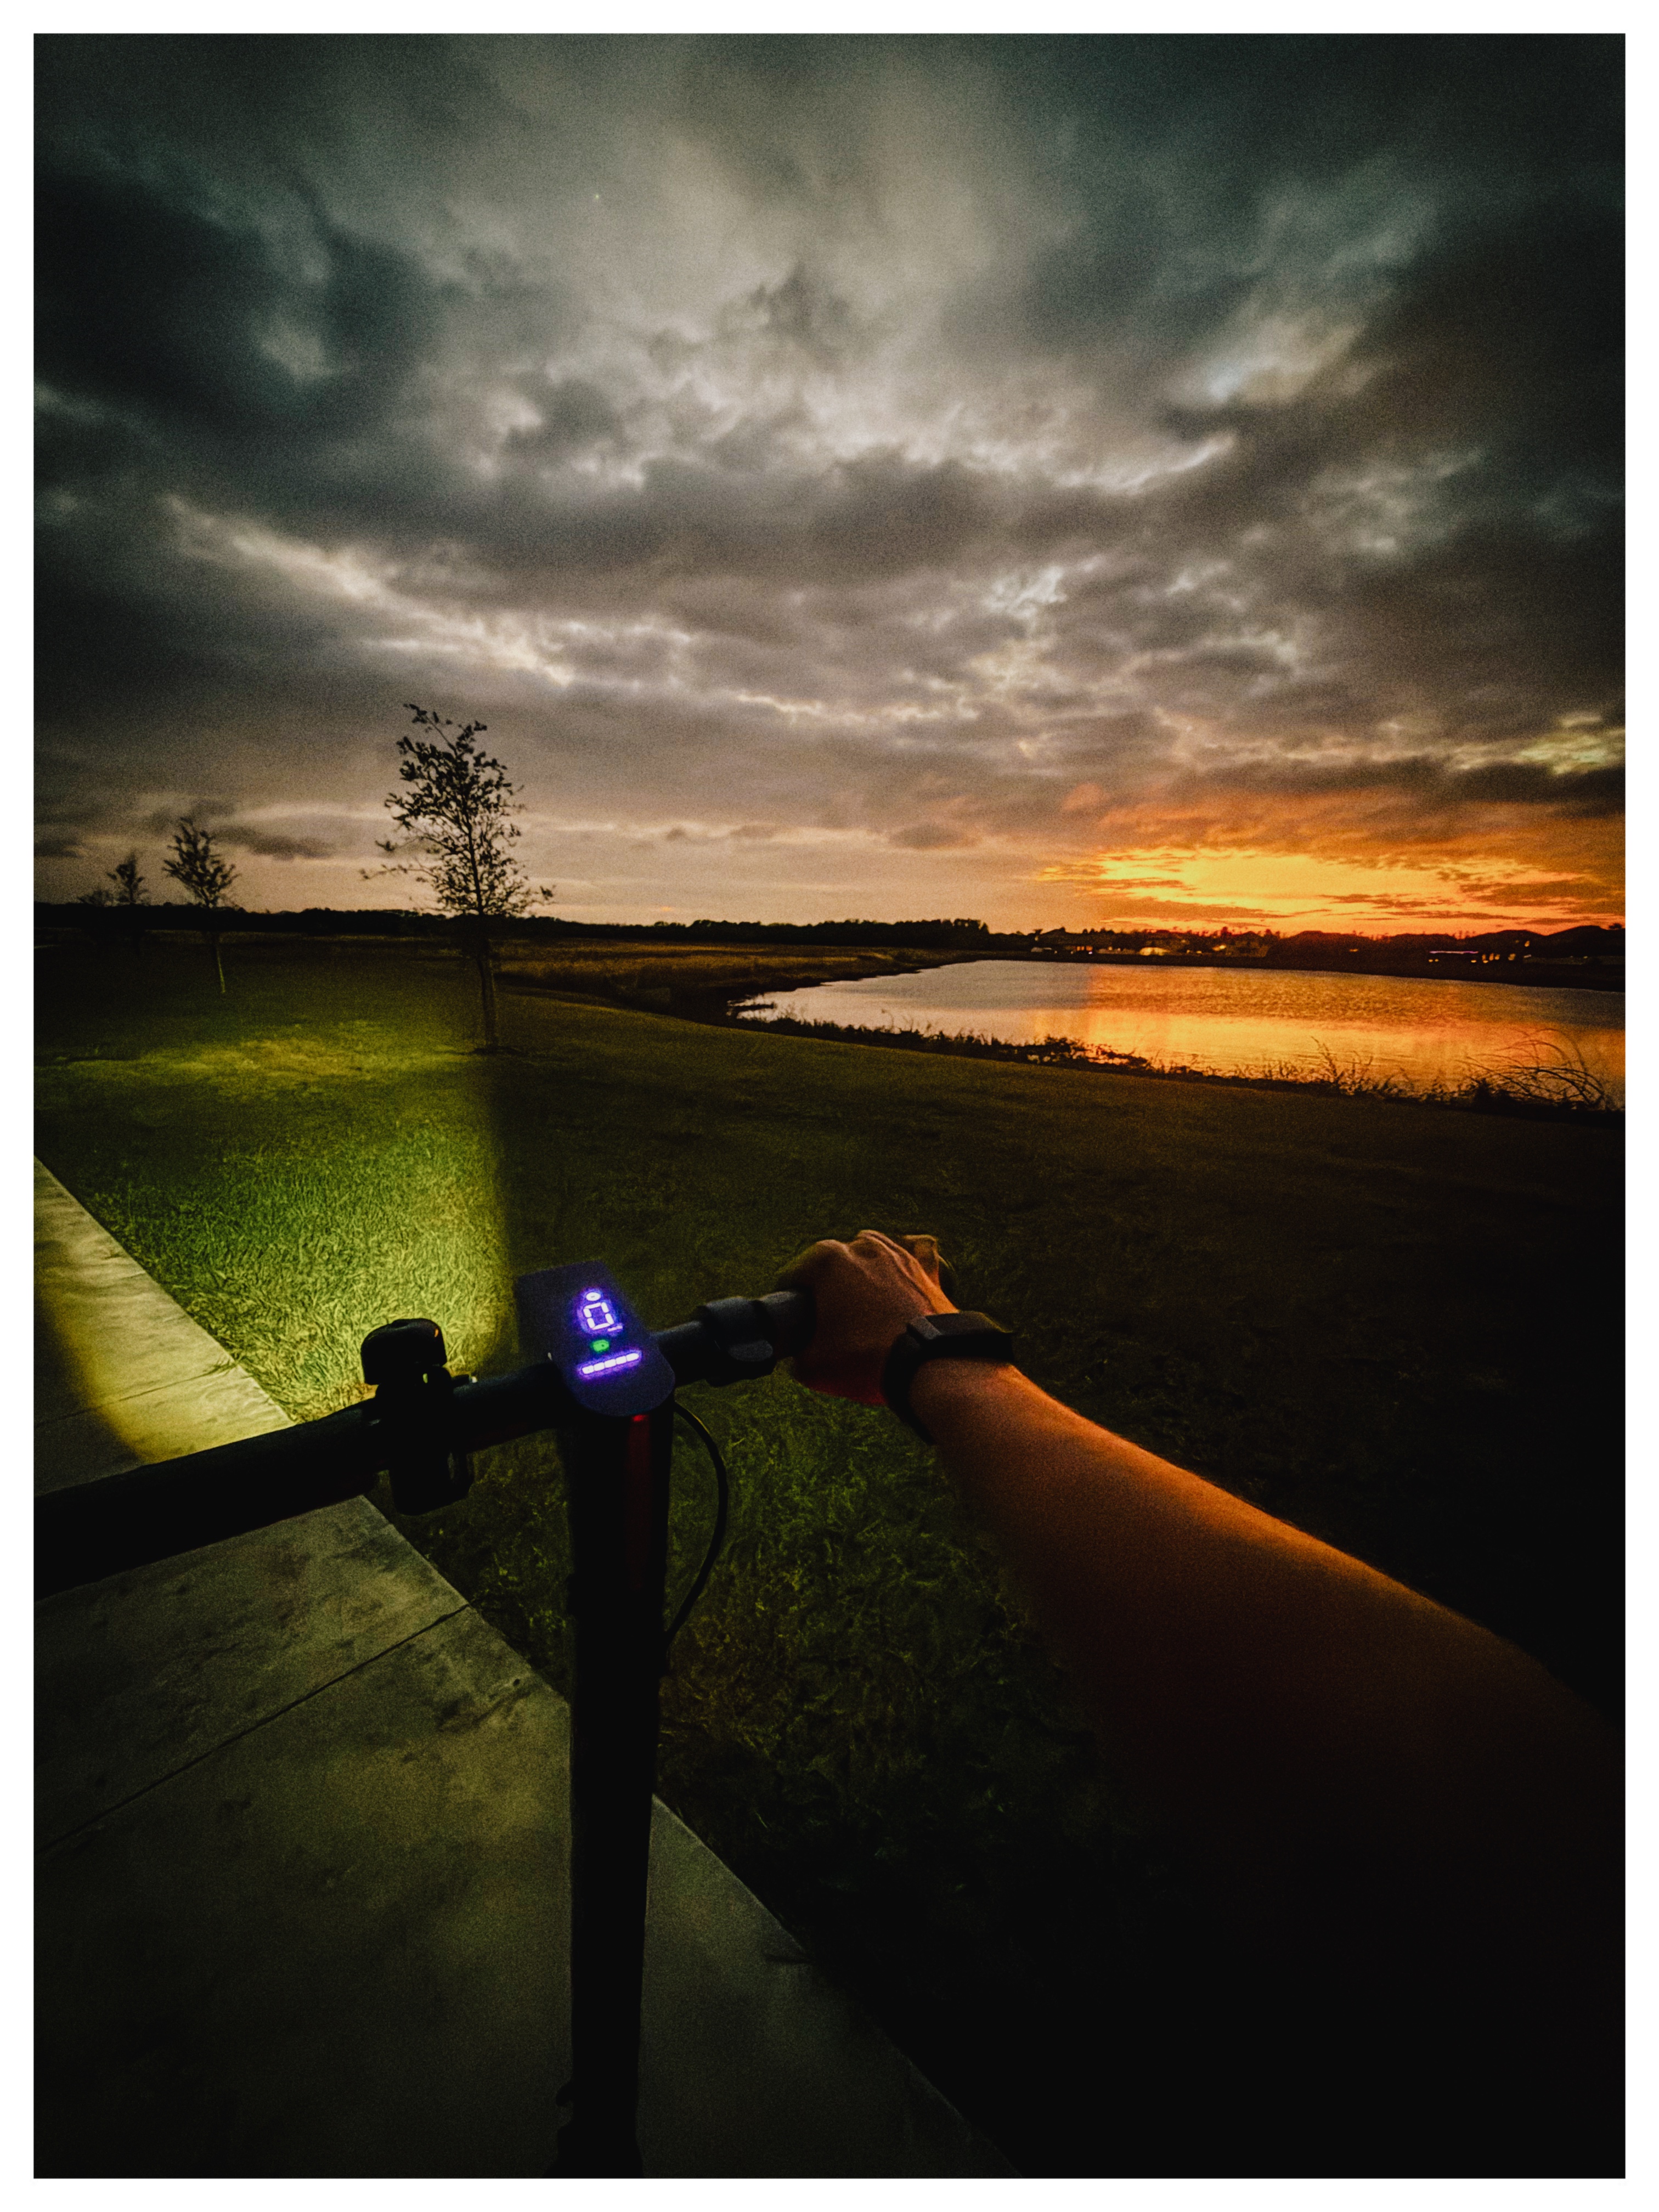
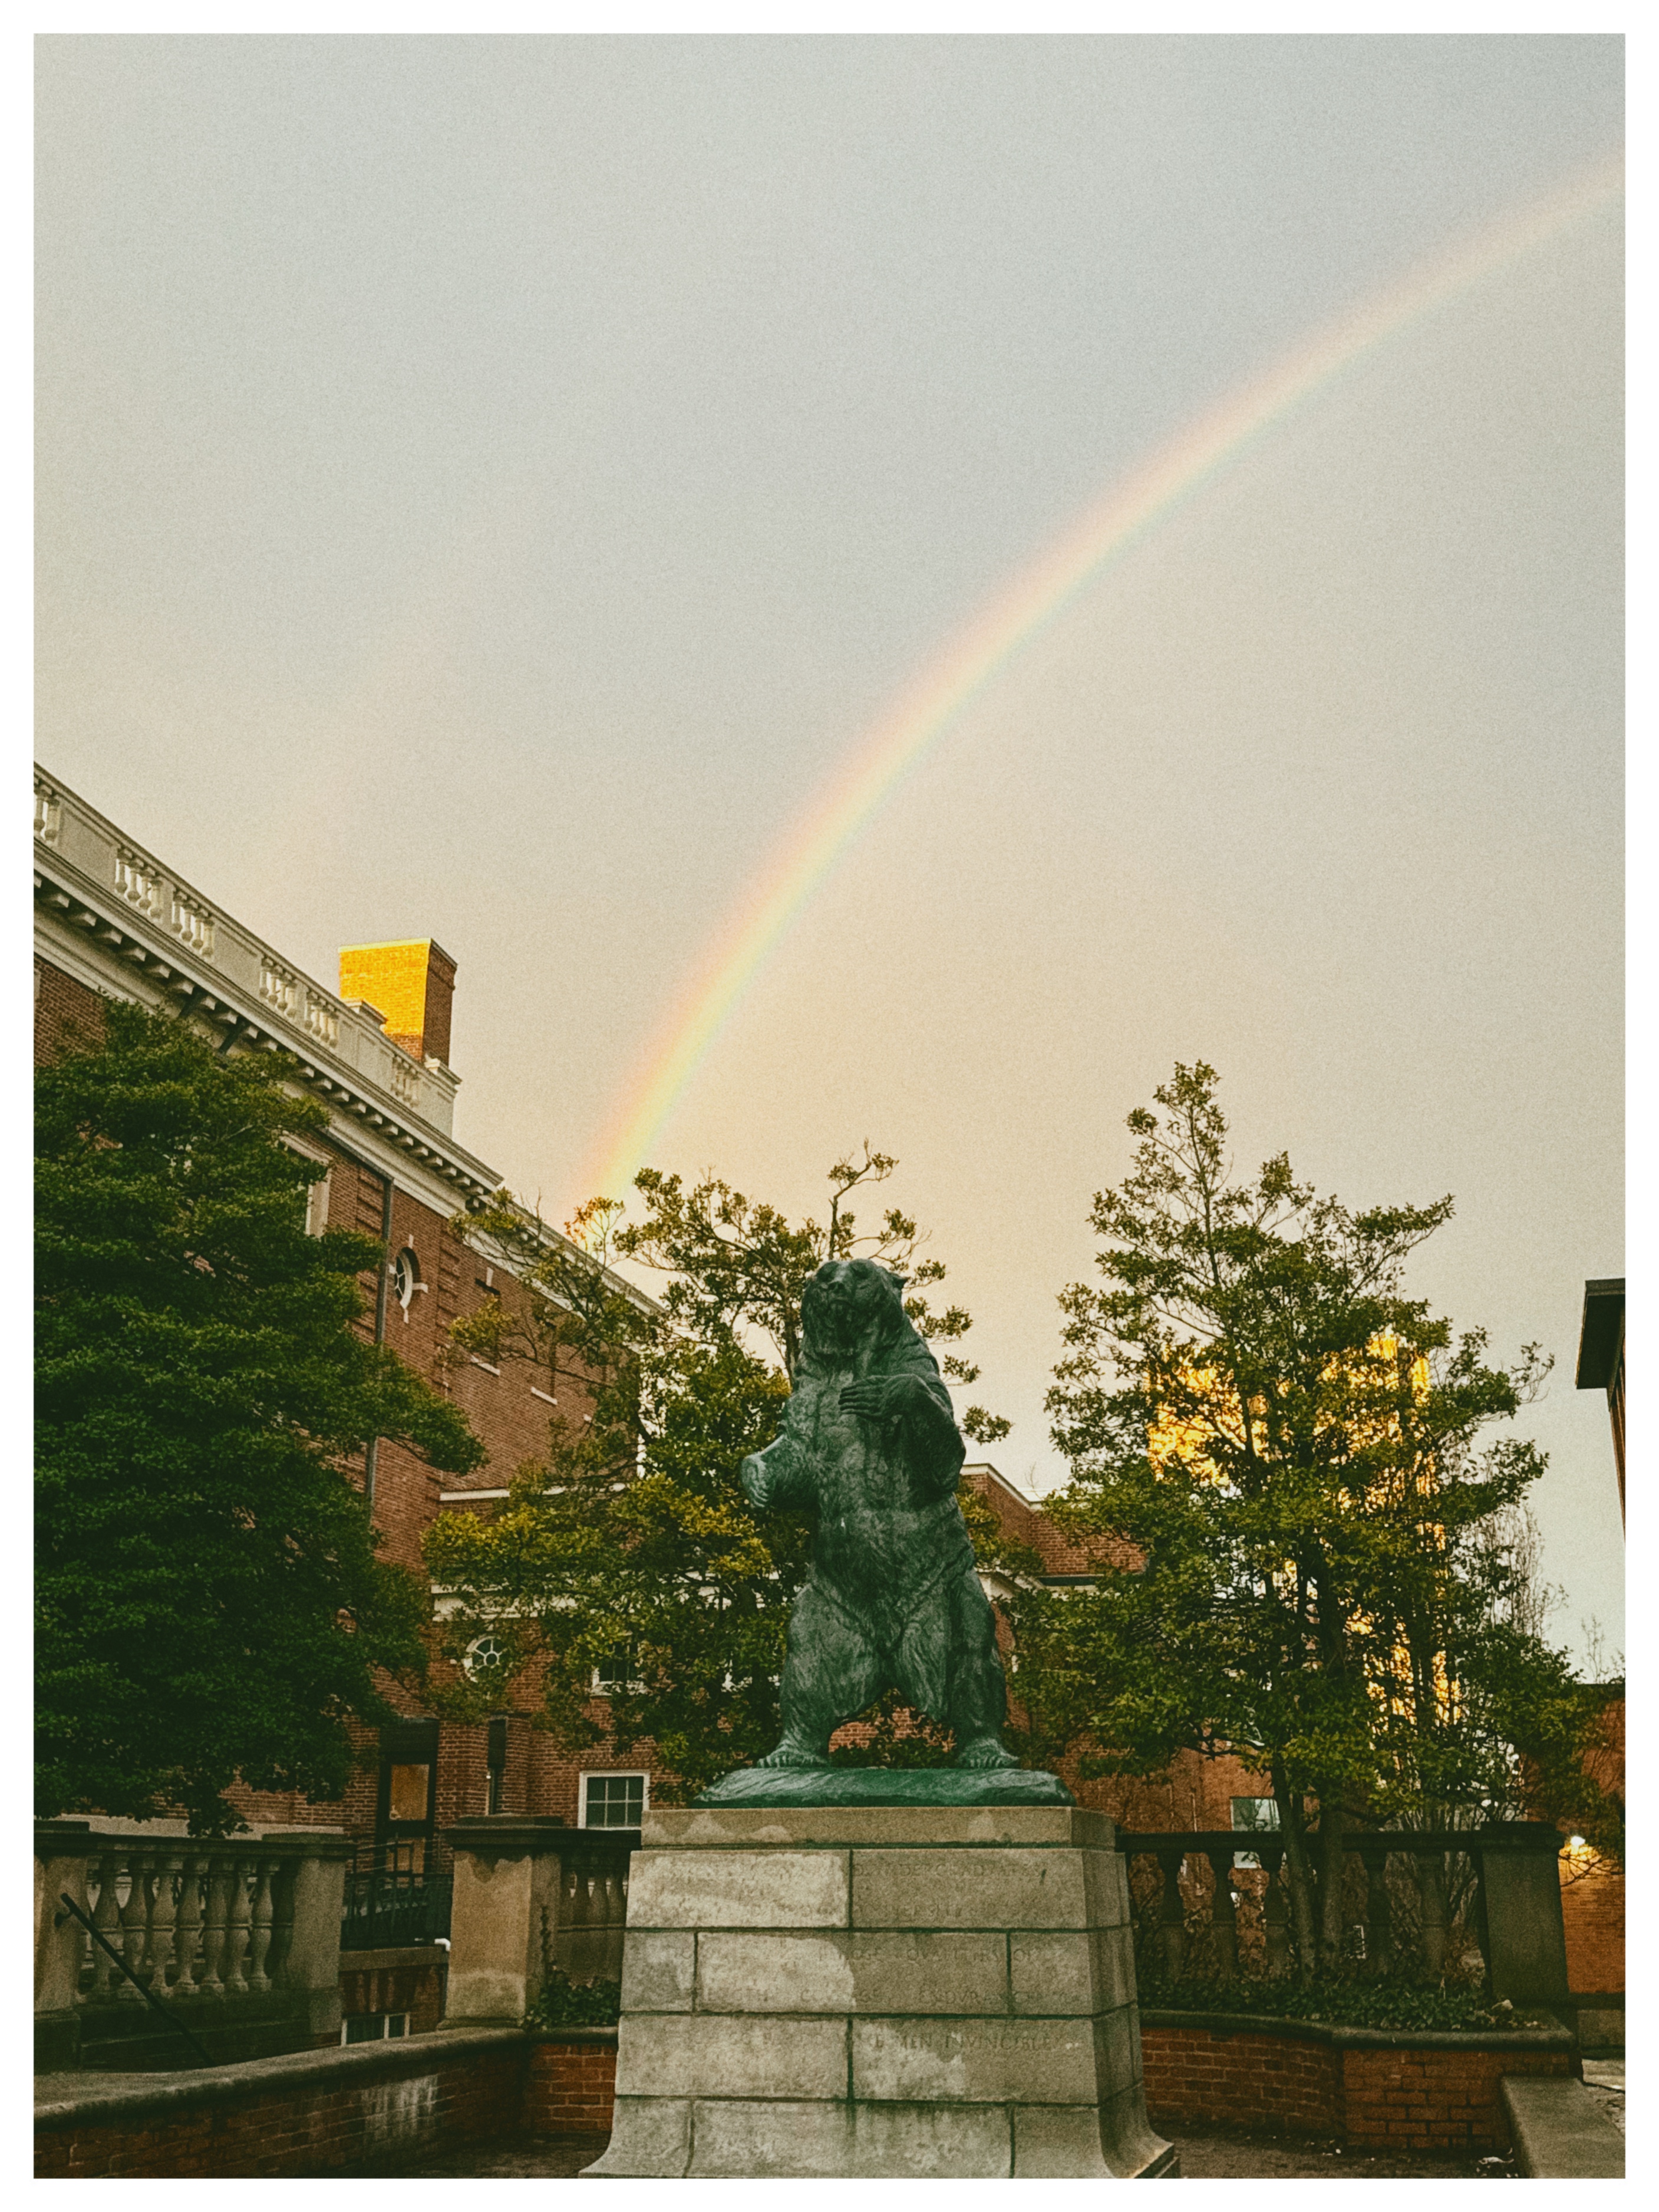
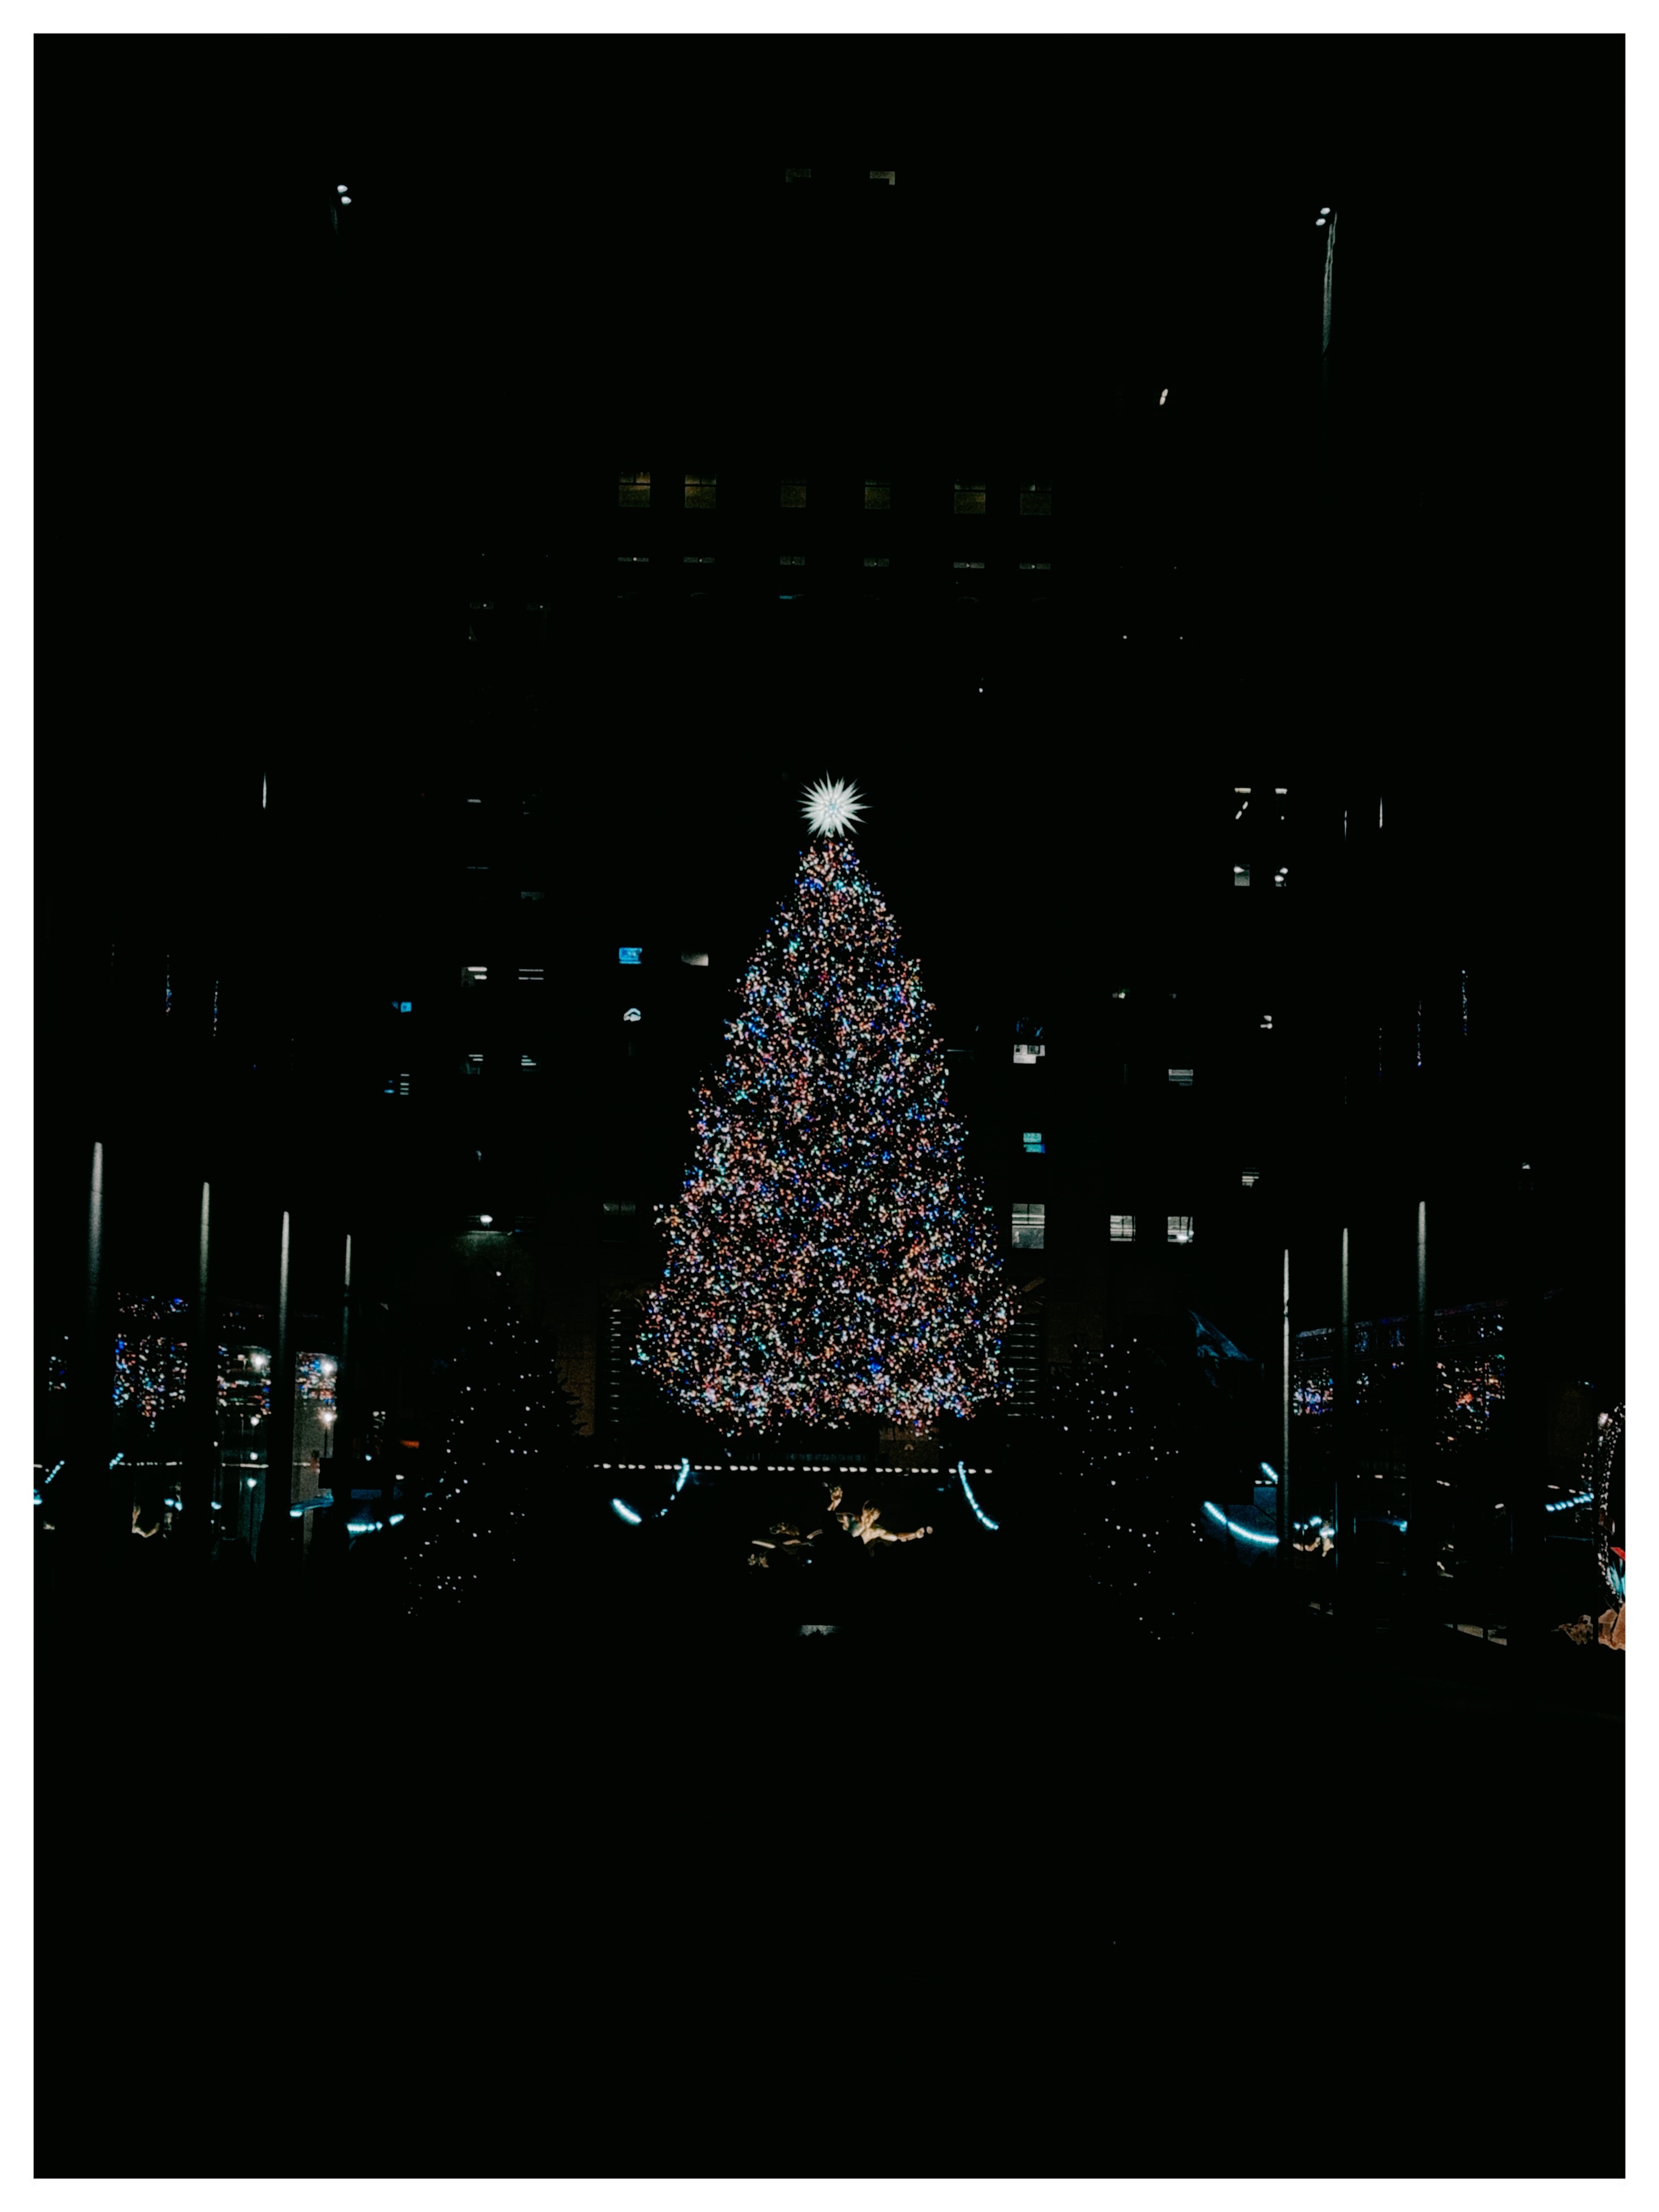
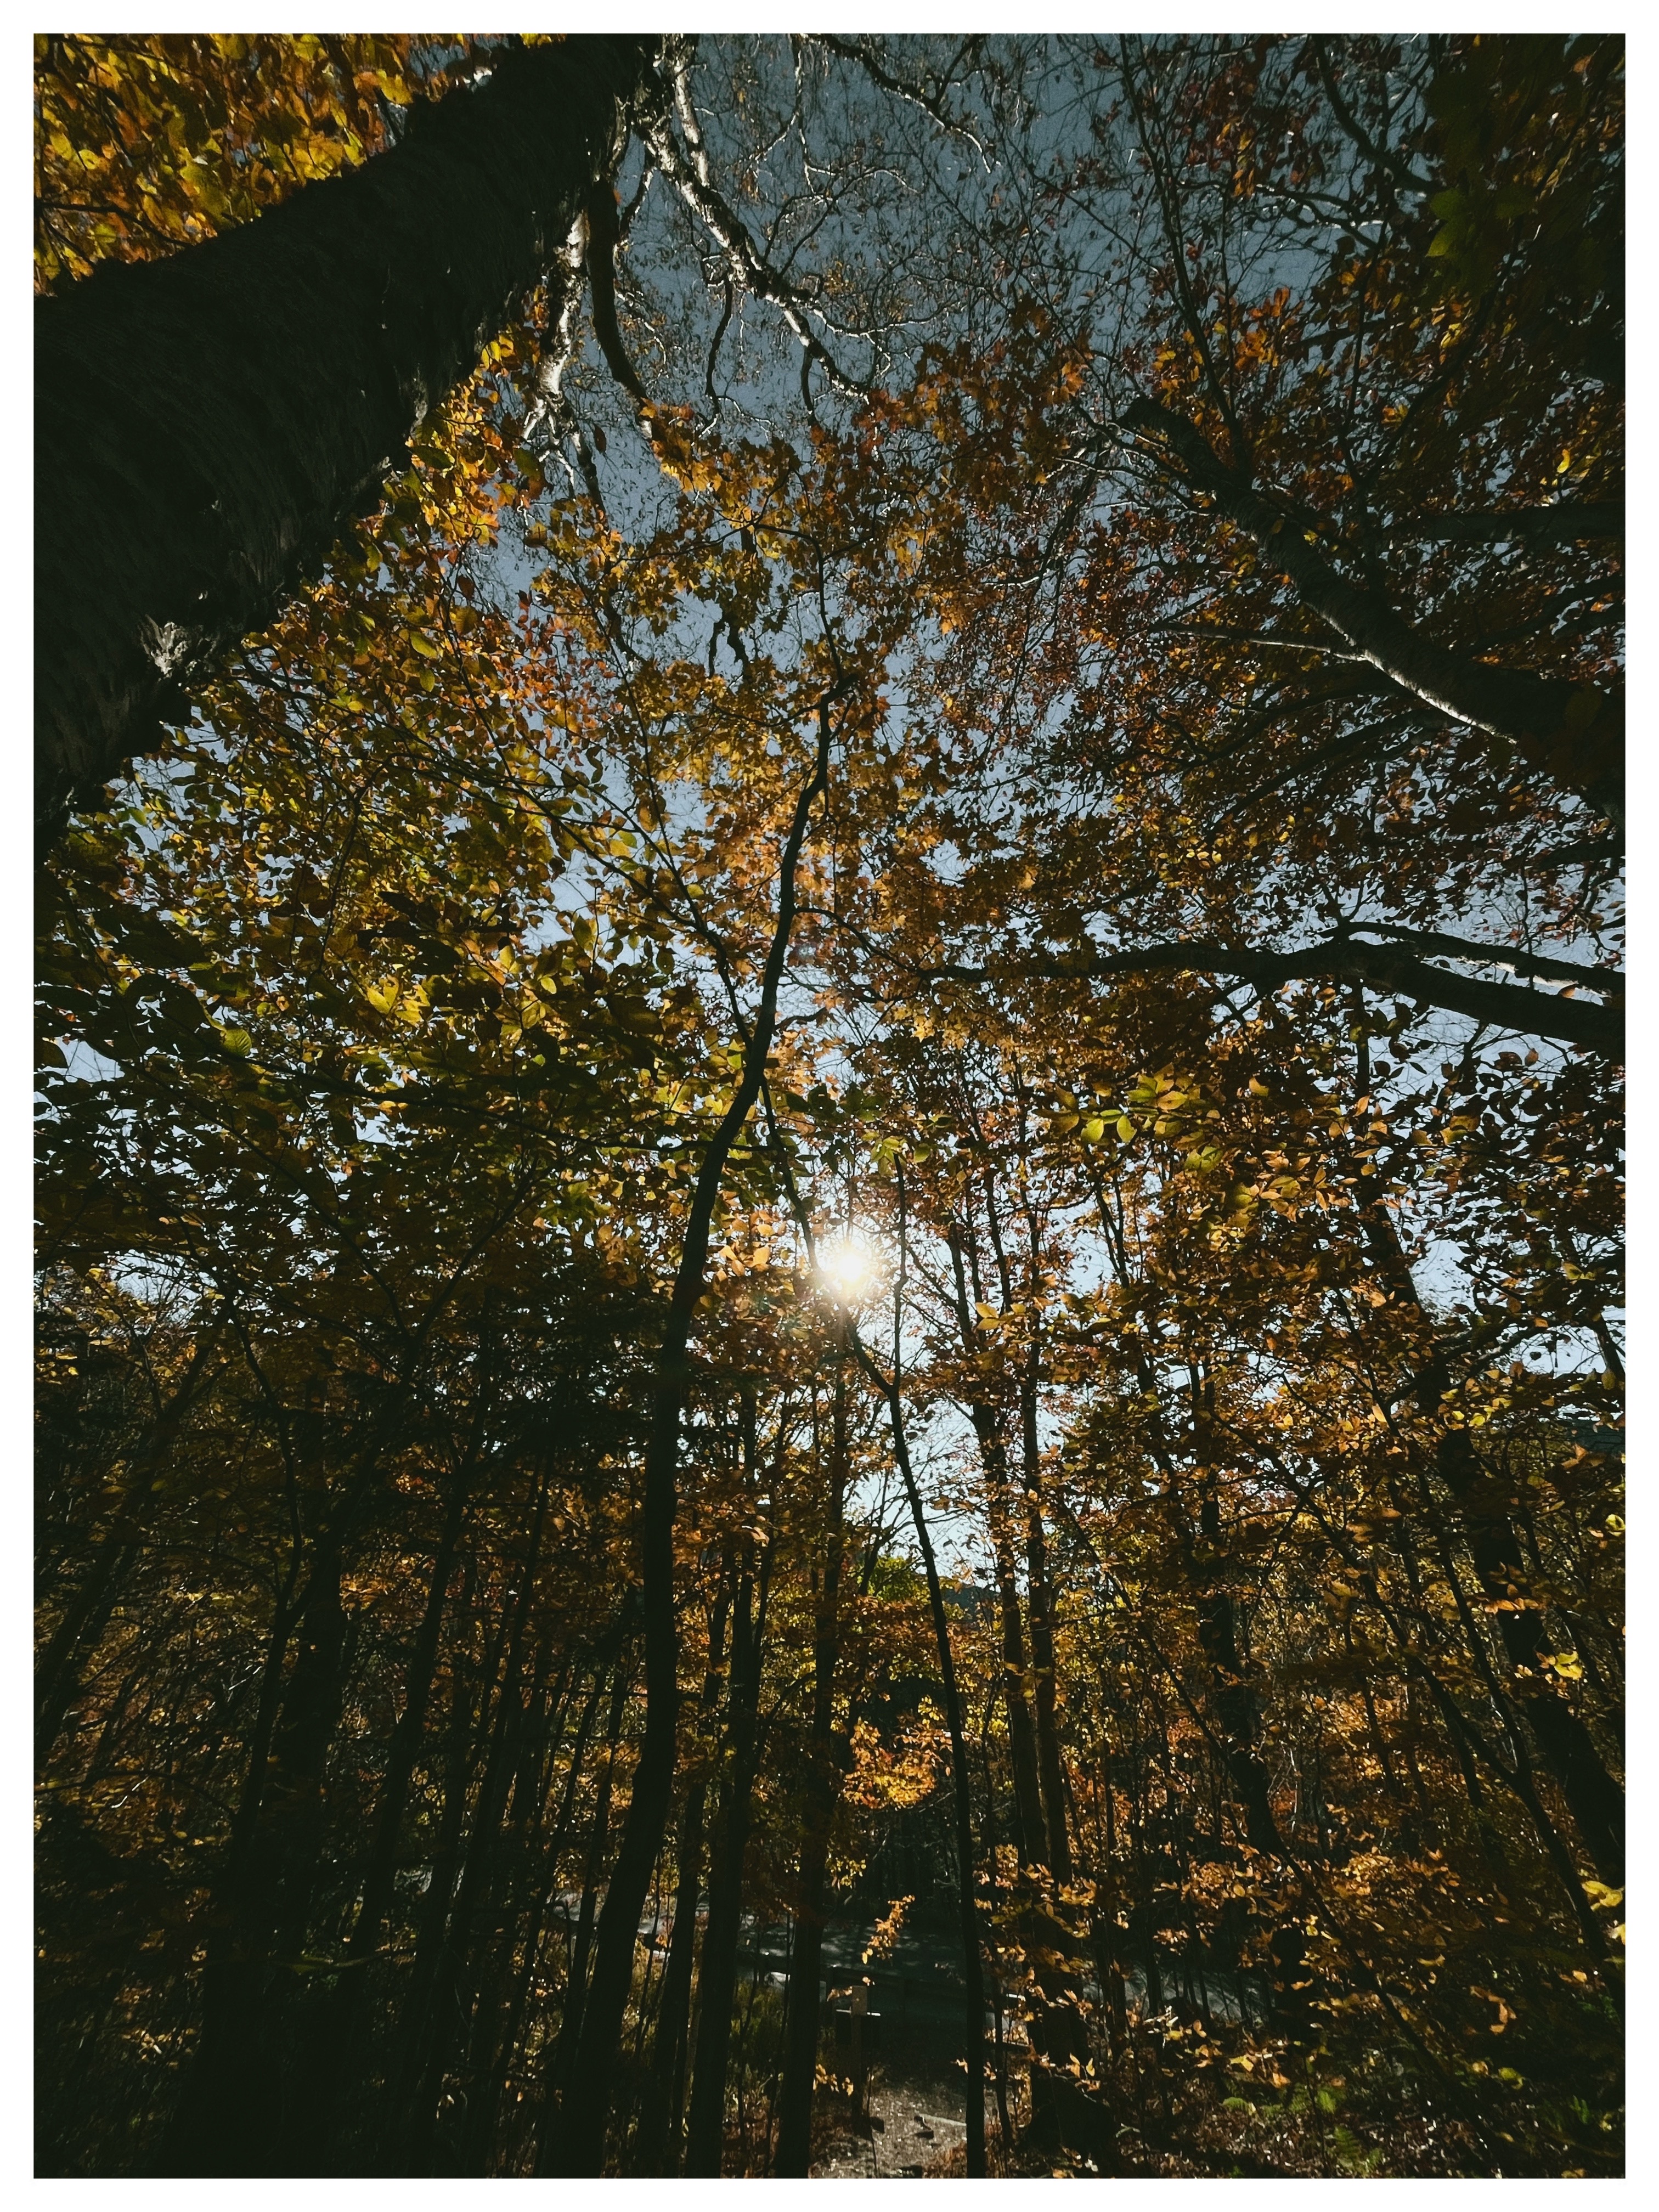
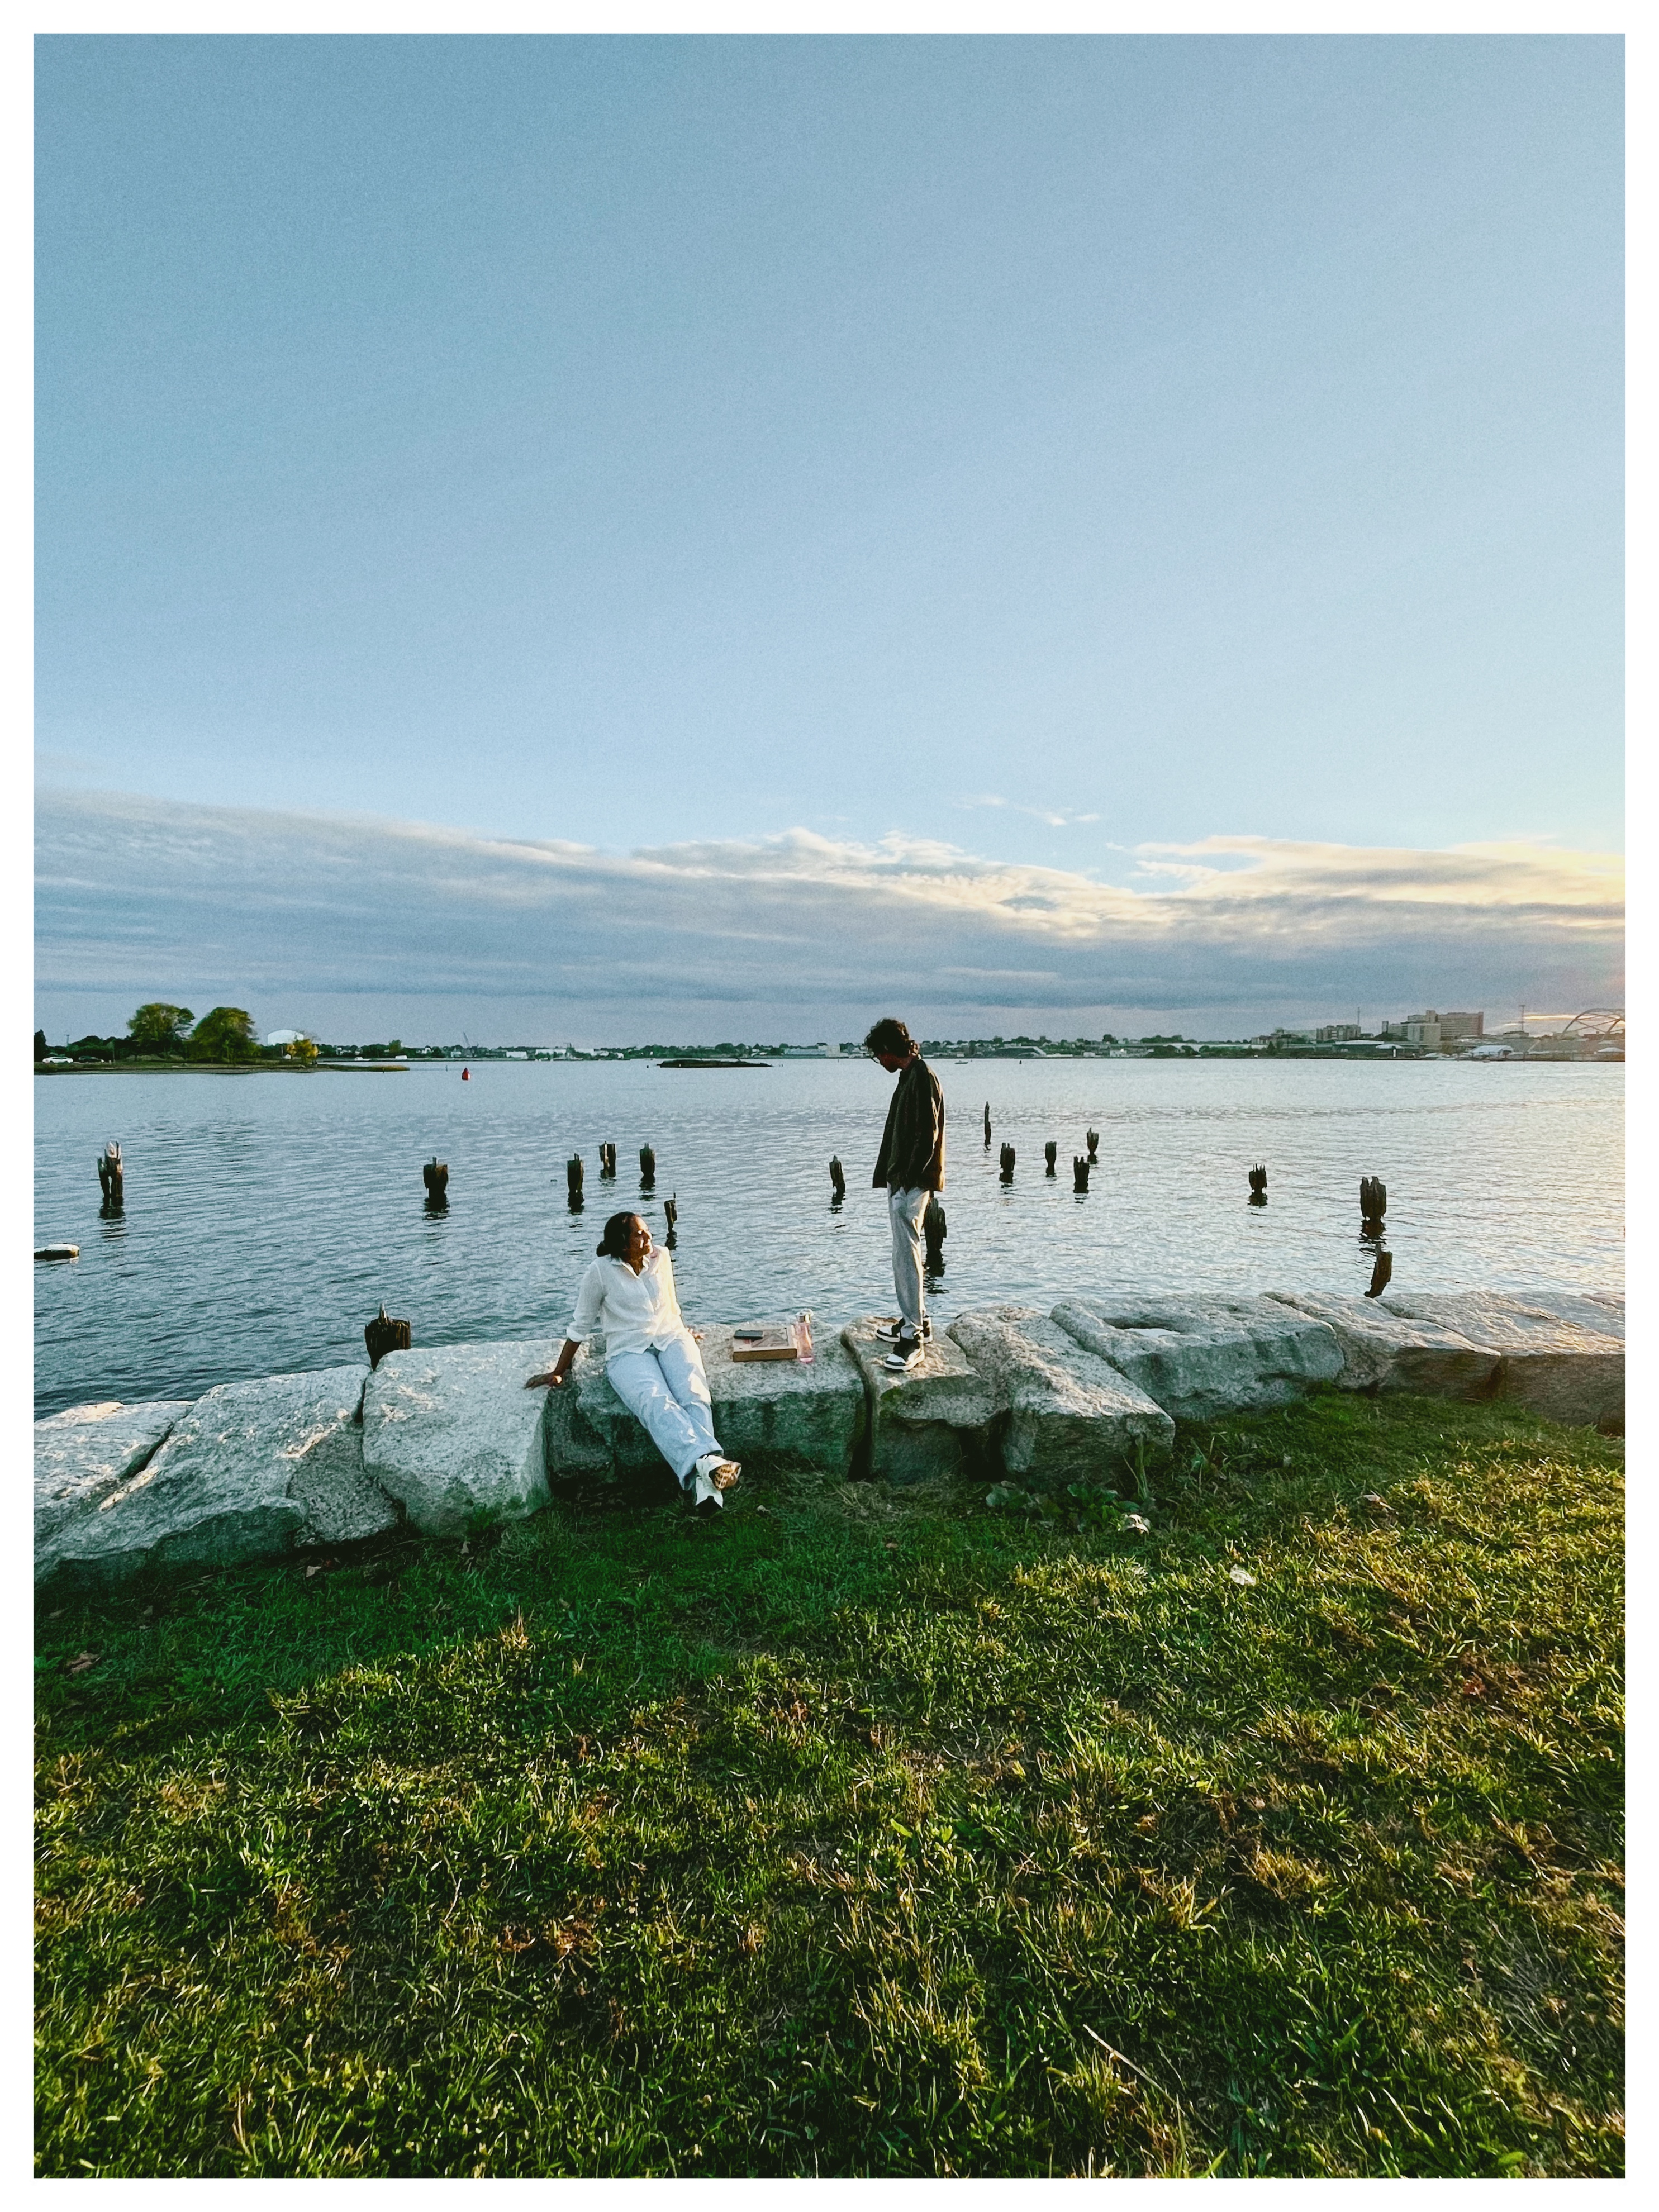
Not a serious practice. I carry a camera and stop for whatever the weather is doing, or for the places where a city runs out and something older takes over. Lately more of it is on film, and I am still learning that part.
Show all




Contact
If any of this interests you, get in touch about research, Formula 1, photography, or anything you know more about than I do, with ice cream optional but strongly encouraged.